Getting Started with Stratora
This guide walks you through installing Stratora and setting up monitoring for your infrastructure. The built-in Setup Wizard handles most of the configuration automatically — you'll go from installation to live dashboards in under 10 minutes.
Already running Stratora? See Upgrading Stratora for the in-place upgrade procedure.
Prerequisites
Before installing, you'll need:
- Windows Server 2016 or later (64-bit) with 4 CPU cores, 16 GB RAM, and 200 GB of disk
- Outbound HTTPS from each monitored host to this server
- SNMP credentials for any network devices you plan to monitor
- Local administrator privileges to run the installer
Need network port specifics, host firewall rules, or device-side SNMP configuration? See the full Prerequisites.
Installation
1. Download and Install
Download the latest Stratora MSI installer from the latest release here: https://github.com/Stratora-Platforms/stratora-releases/releases. The release page lists a single Stratora-Server-X.Y.Z.msi asset — the Agent and Collector installers are bundled inside this Server MSI and do not need to be downloaded separately. Run the installer on your designated monitoring server:
msiexec /i Stratora-Server-X.Y.Z.msi /qn
Replace X.Y.Z with the version you downloaded. The installer configures all required Stratora services automatically.
2. Verify Services
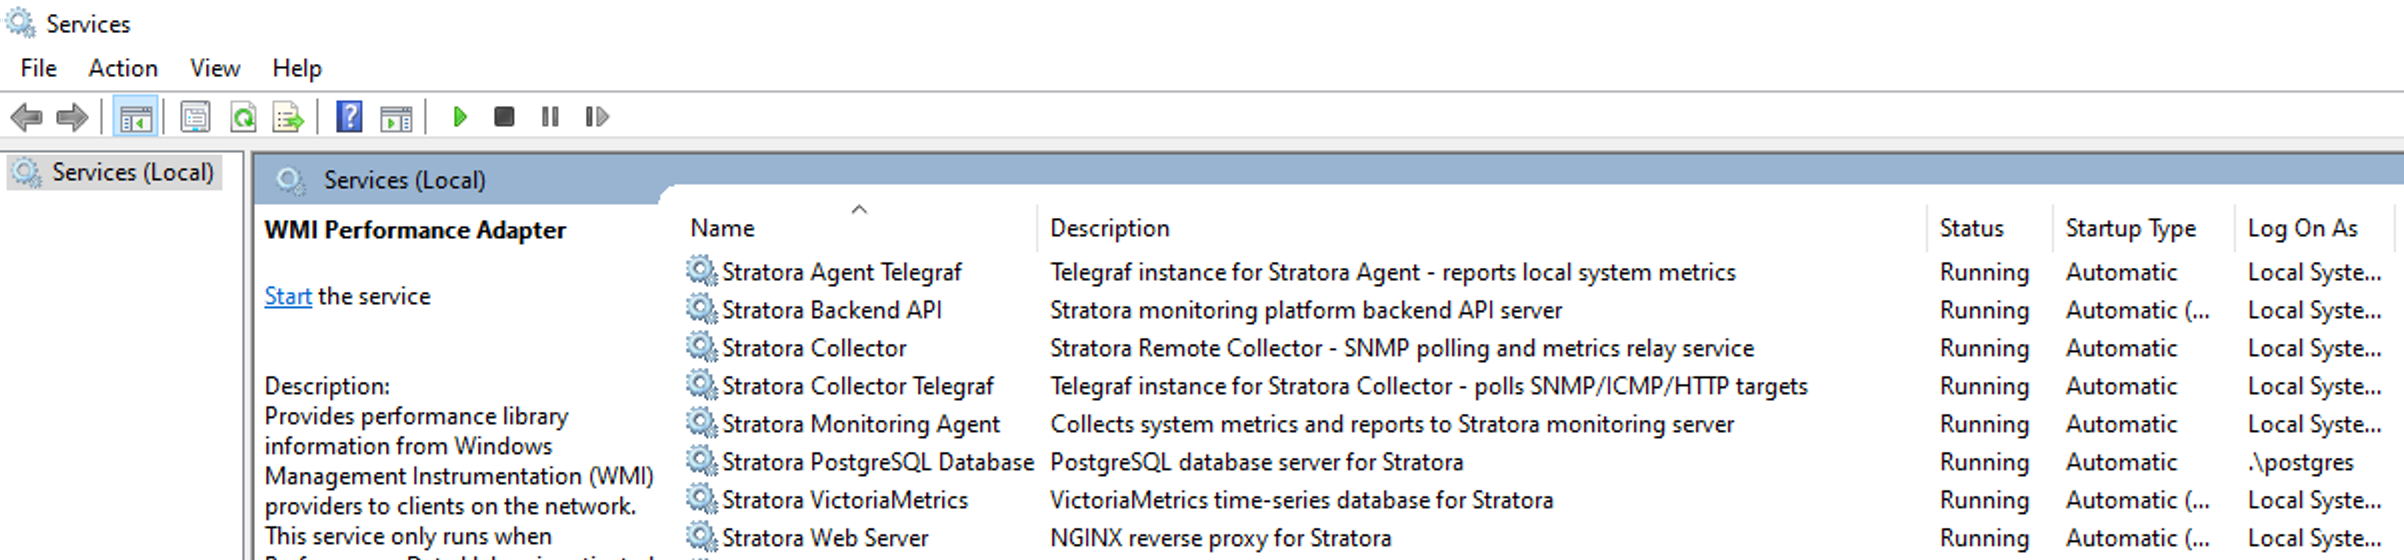
After installation, confirm all Stratora services are running:
- Stratora Backend API — core API and web interface
- Stratora VictoriaMetrics — time-series storage
- Stratora Collector — SNMP polling and metrics relay
- Stratora Collector Telegraf — polls SNMP/ICMP/HTTP targets
- Stratora Web Server — NGINX reverse proxy serving the UI
- Stratora PostgreSQL Database — database server
- Stratora Agent Telegraf — local system metrics (on the Stratora server itself)
- Stratora Monitoring Agent — collects system metrics and reports to Stratora
3. Access the Web Interface
Open a browser and navigate to https://your-server-hostname. Log in with the default credentials — username admin, password admin. You will be prompted to set a new password on first login.
Setup Wizard
In the next few minutes, you will:
- Discover devices across your network automatically
- Have dashboards, topology maps, and health scoring generated instantly
- Receive alerts the moment something goes wrong
- Go from zero to full infrastructure visibility — without manual configuration
On first login, the Setup Wizard opens automatically. It guides you through 10 steps — most of which Stratora completes automatically on your behalf. By the end, your network is discovered, devices are imported with templates pre-assigned, dashboards are live, and alerting is active.
The wizard is re-runnable and additive. You can close it at any time (your progress is saved), and relaunch it from the Home page. Running it again won't duplicate existing configuration — it detects what's already set up and lets you add more.
Step 1: Welcome
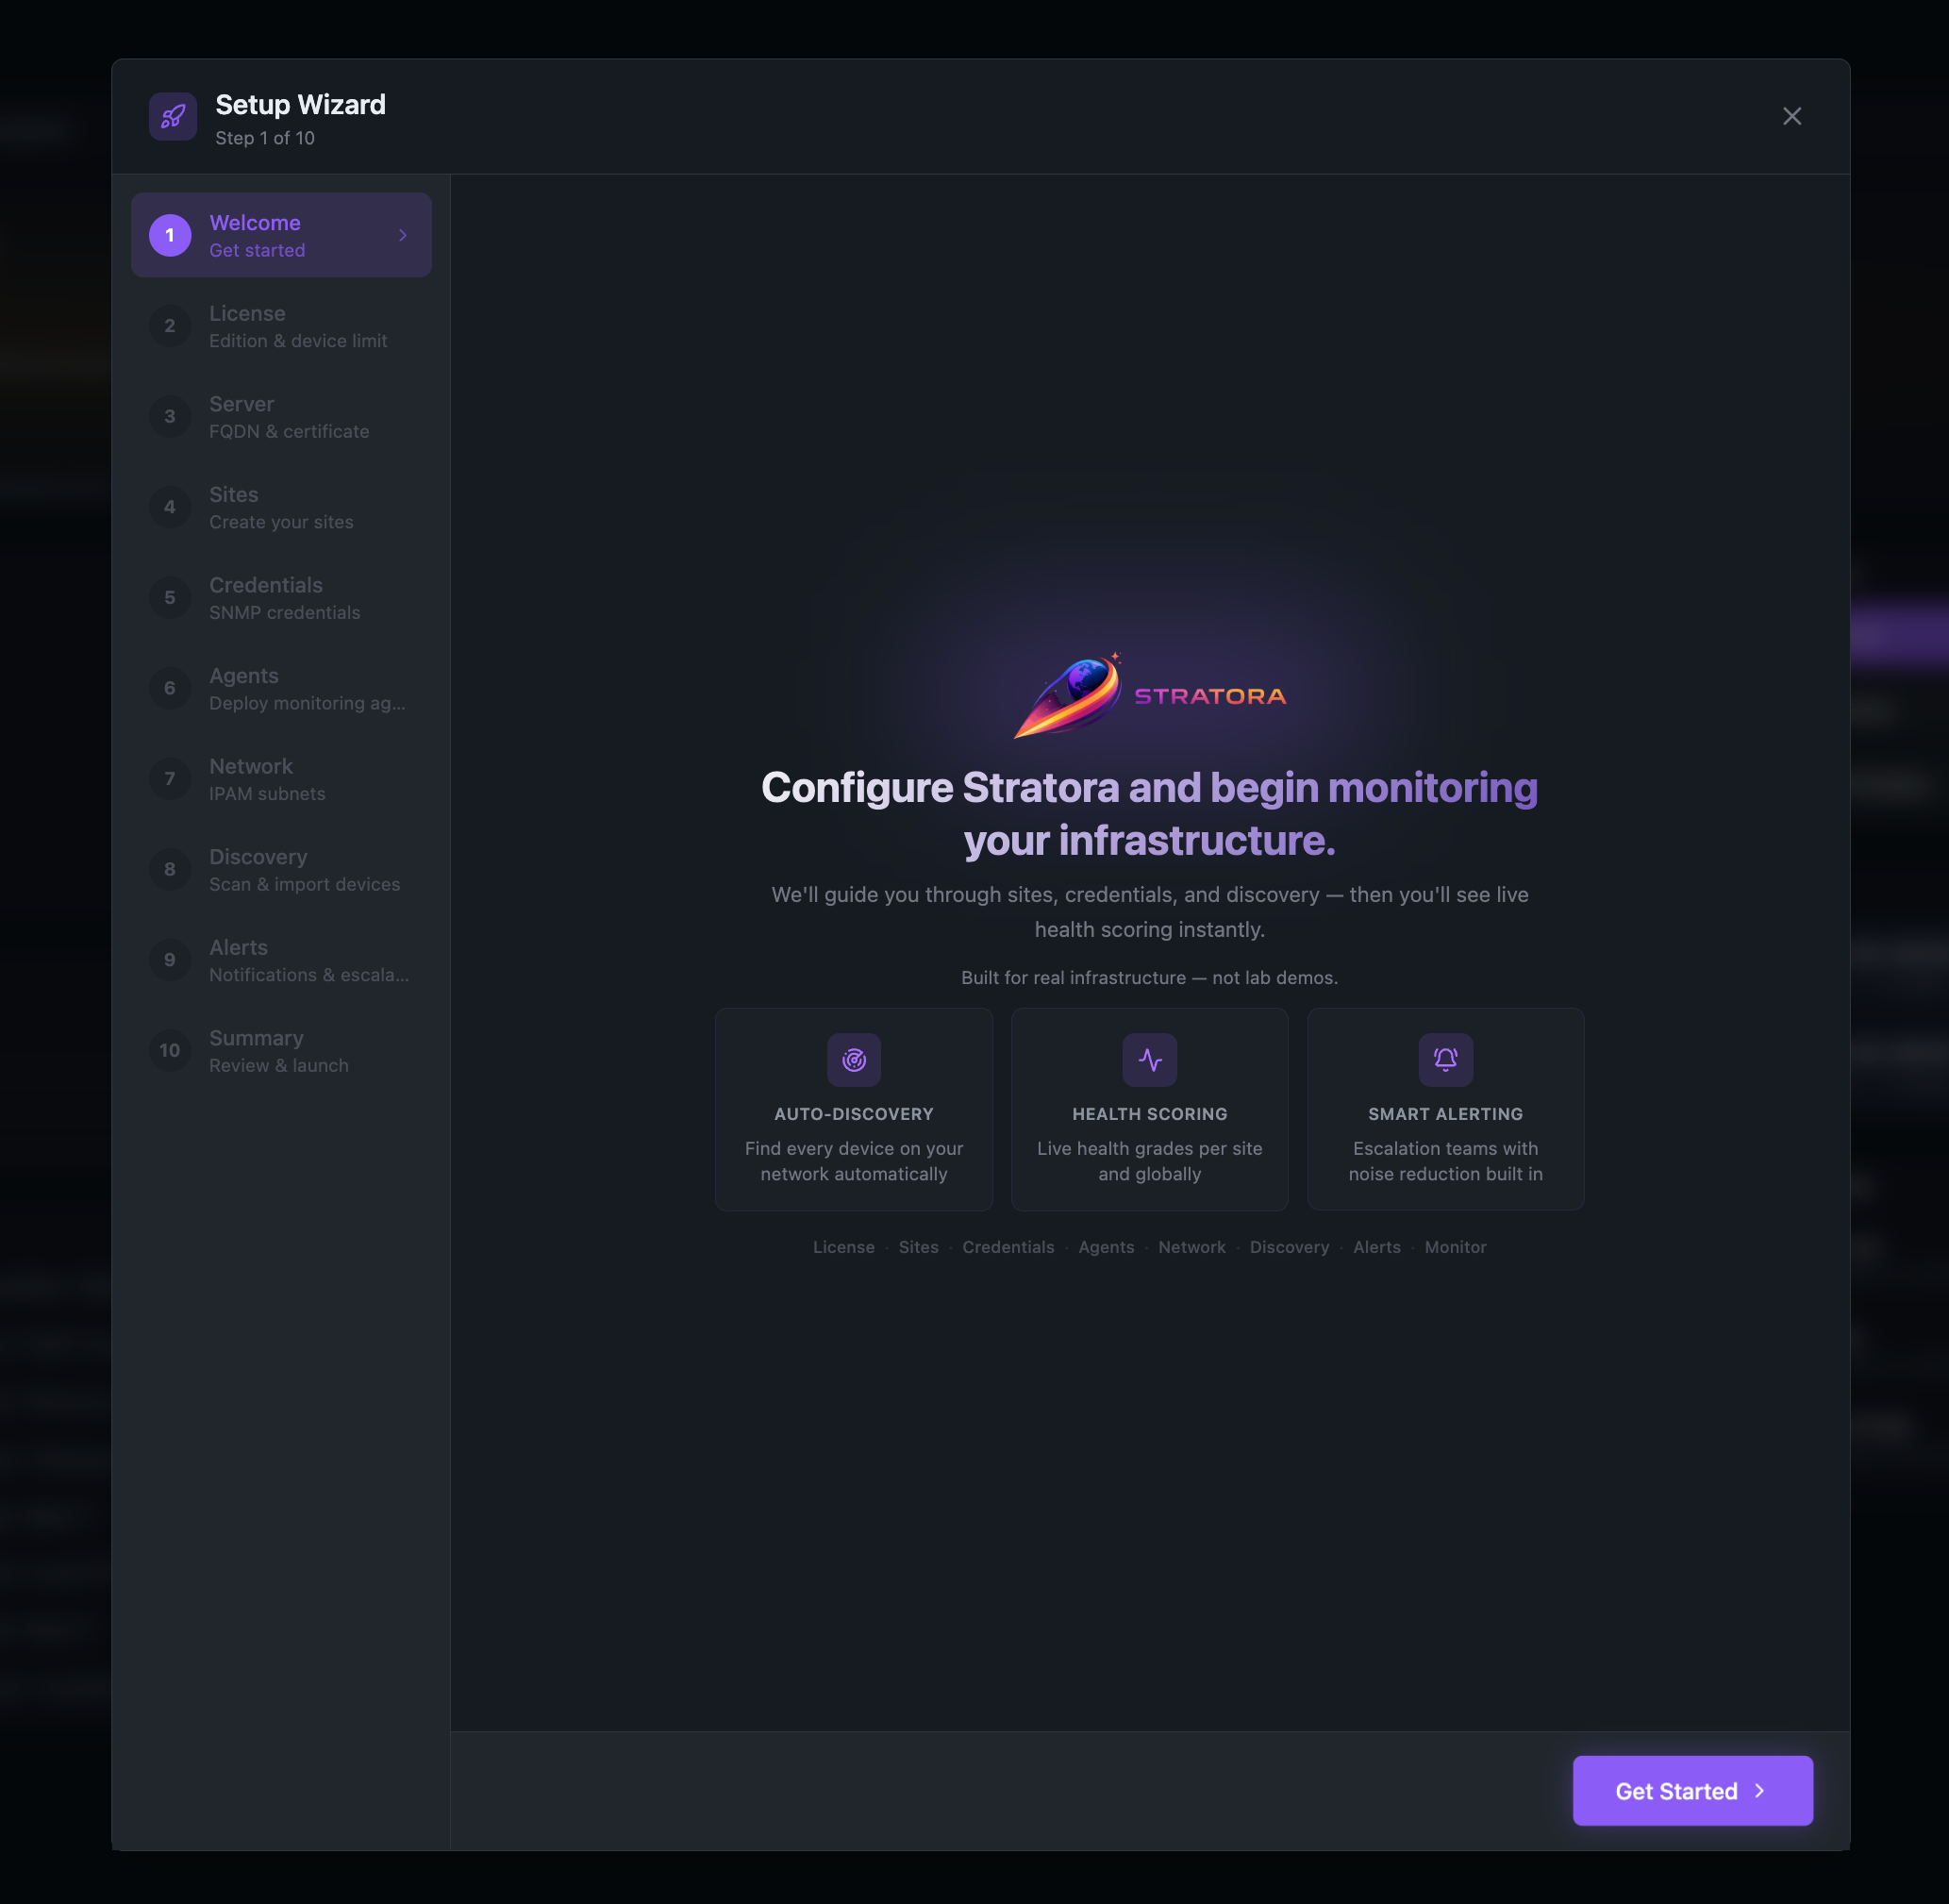
The welcome screen outlines what the wizard will configure. Click Get Started to begin.
Step 2: License
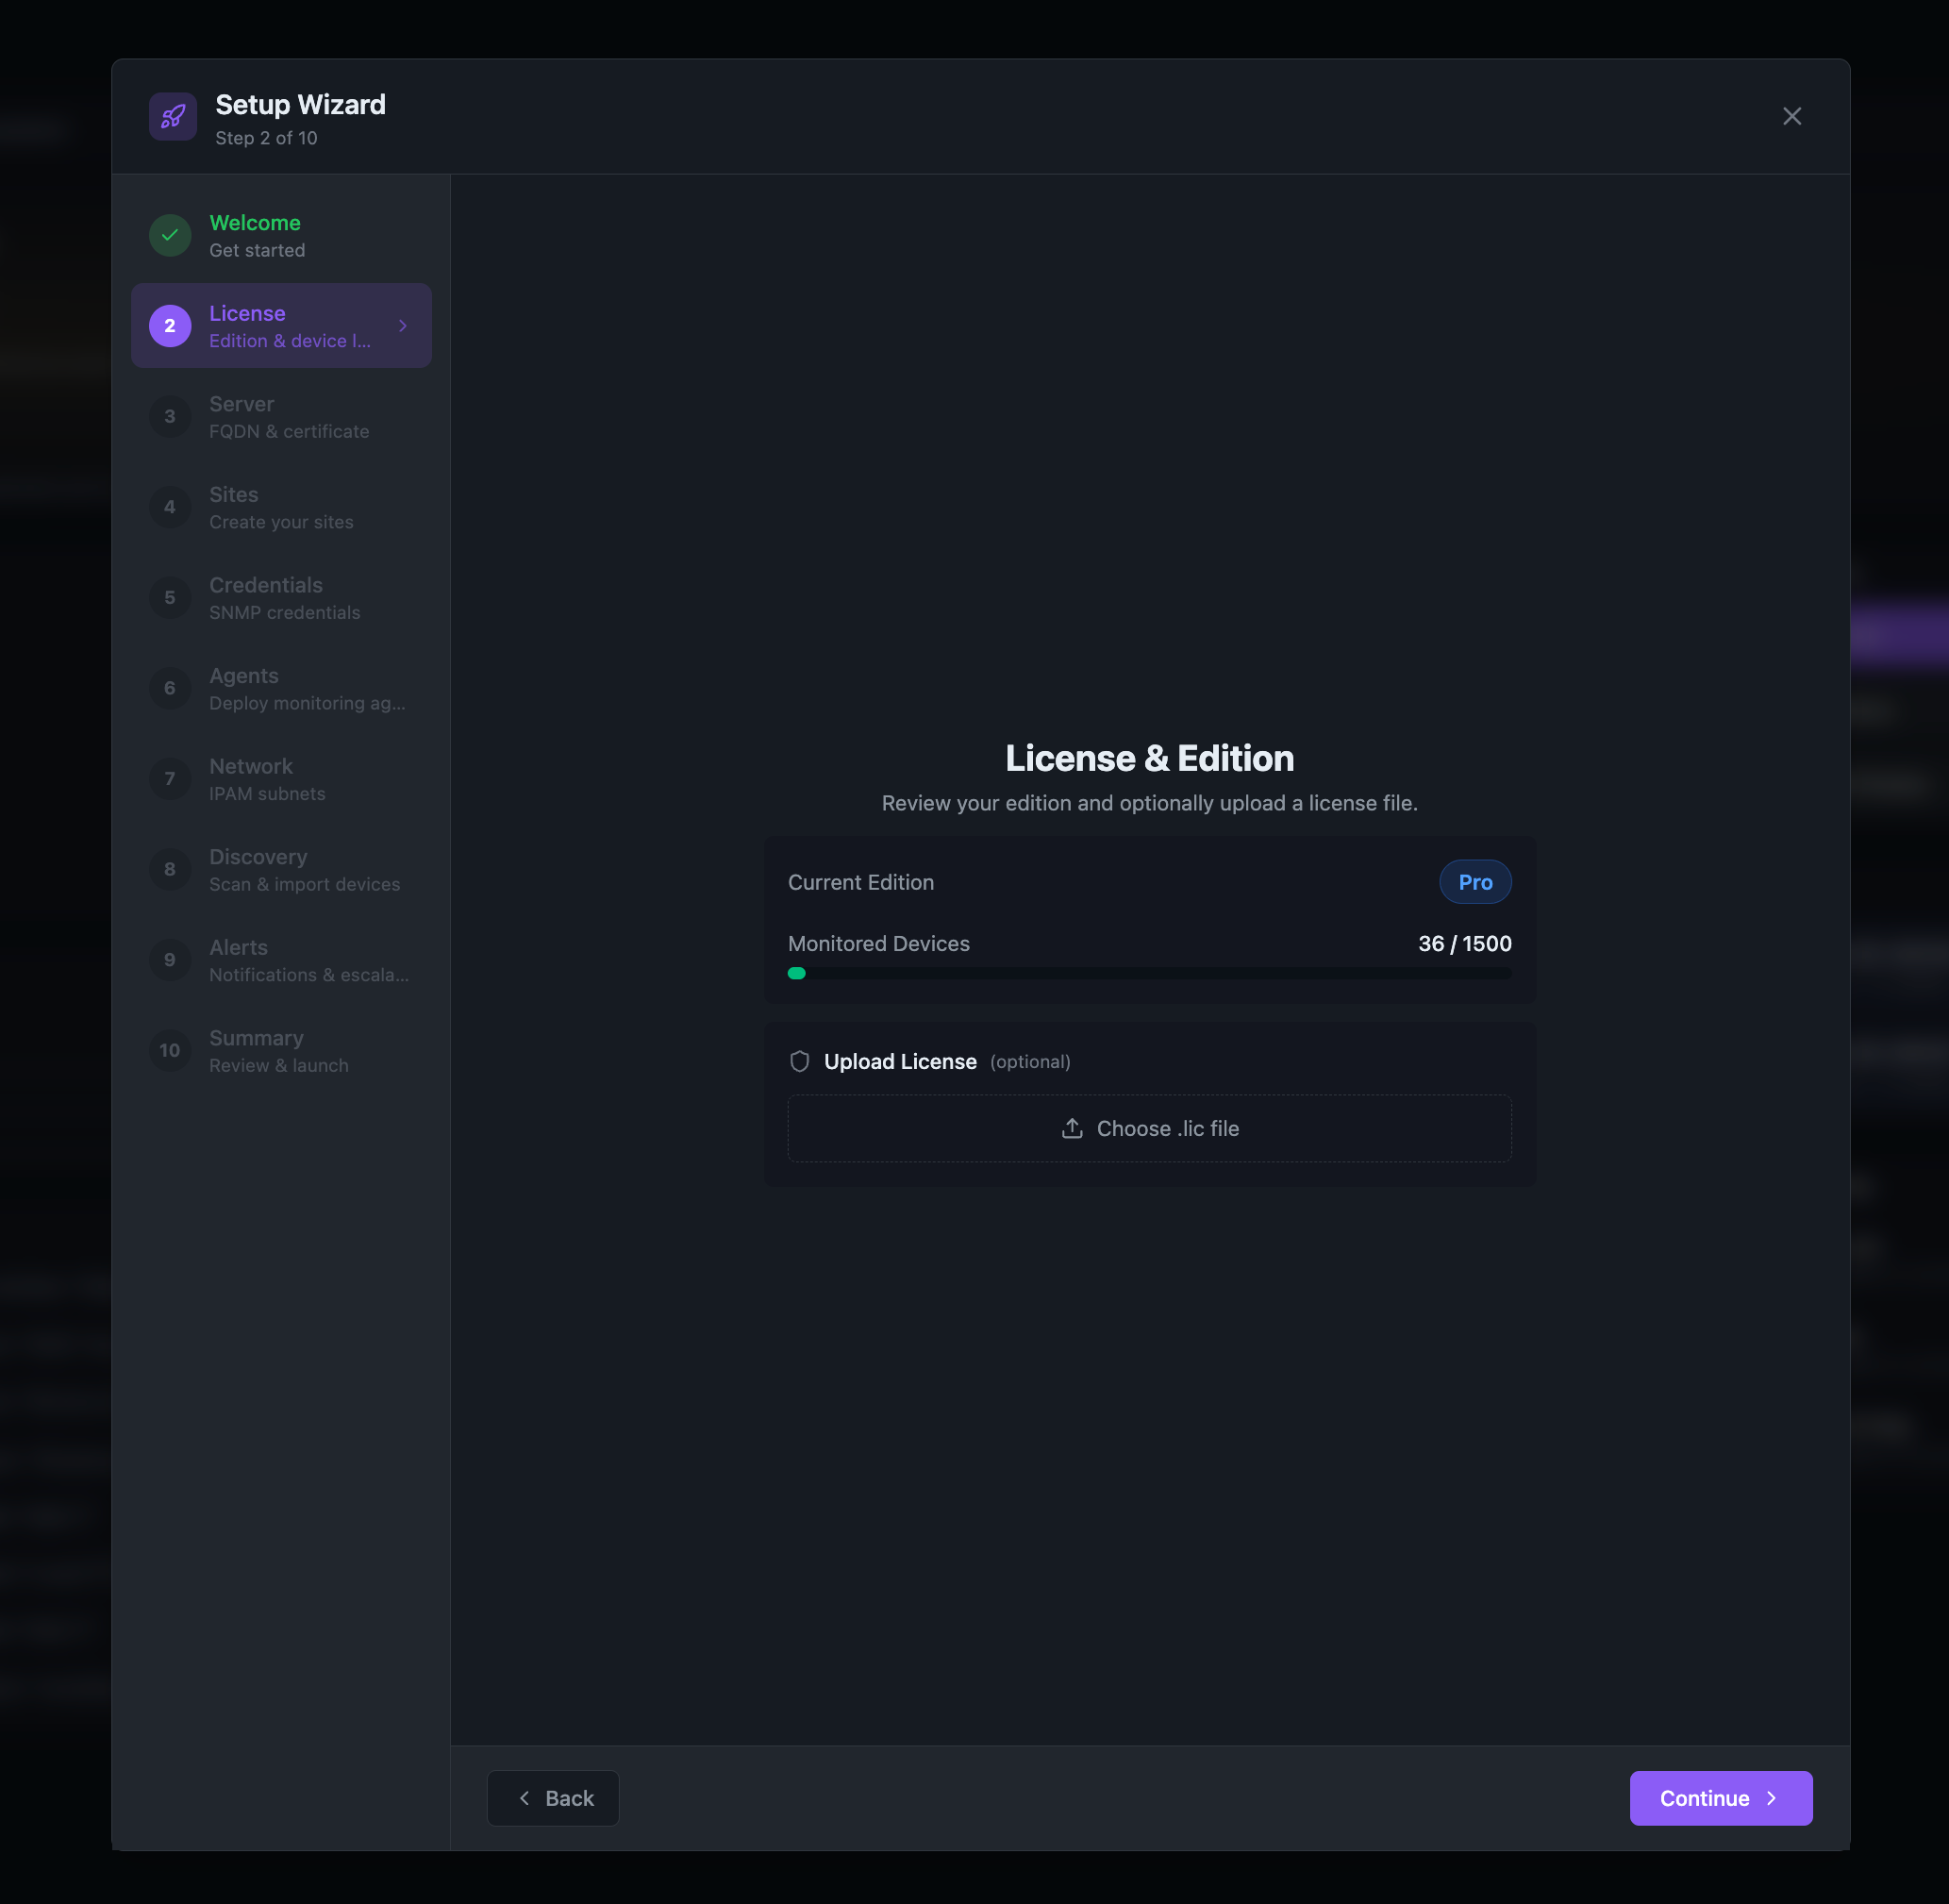
Stratora runs in Community edition by default, which supports up to 100 monitored devices. If you have a Pro or Enterprise license, upload it here to unlock your licensed device limit and features:
- Click Upload License
- Select your
.licfile - The edition and device limit update immediately
The device headroom bar shows how many of your licensed slots are in use. Node limits are enforced only on actively monitored devices — discovered but unimported devices don't count.
Step 3: Server (FQDN & Certificate)
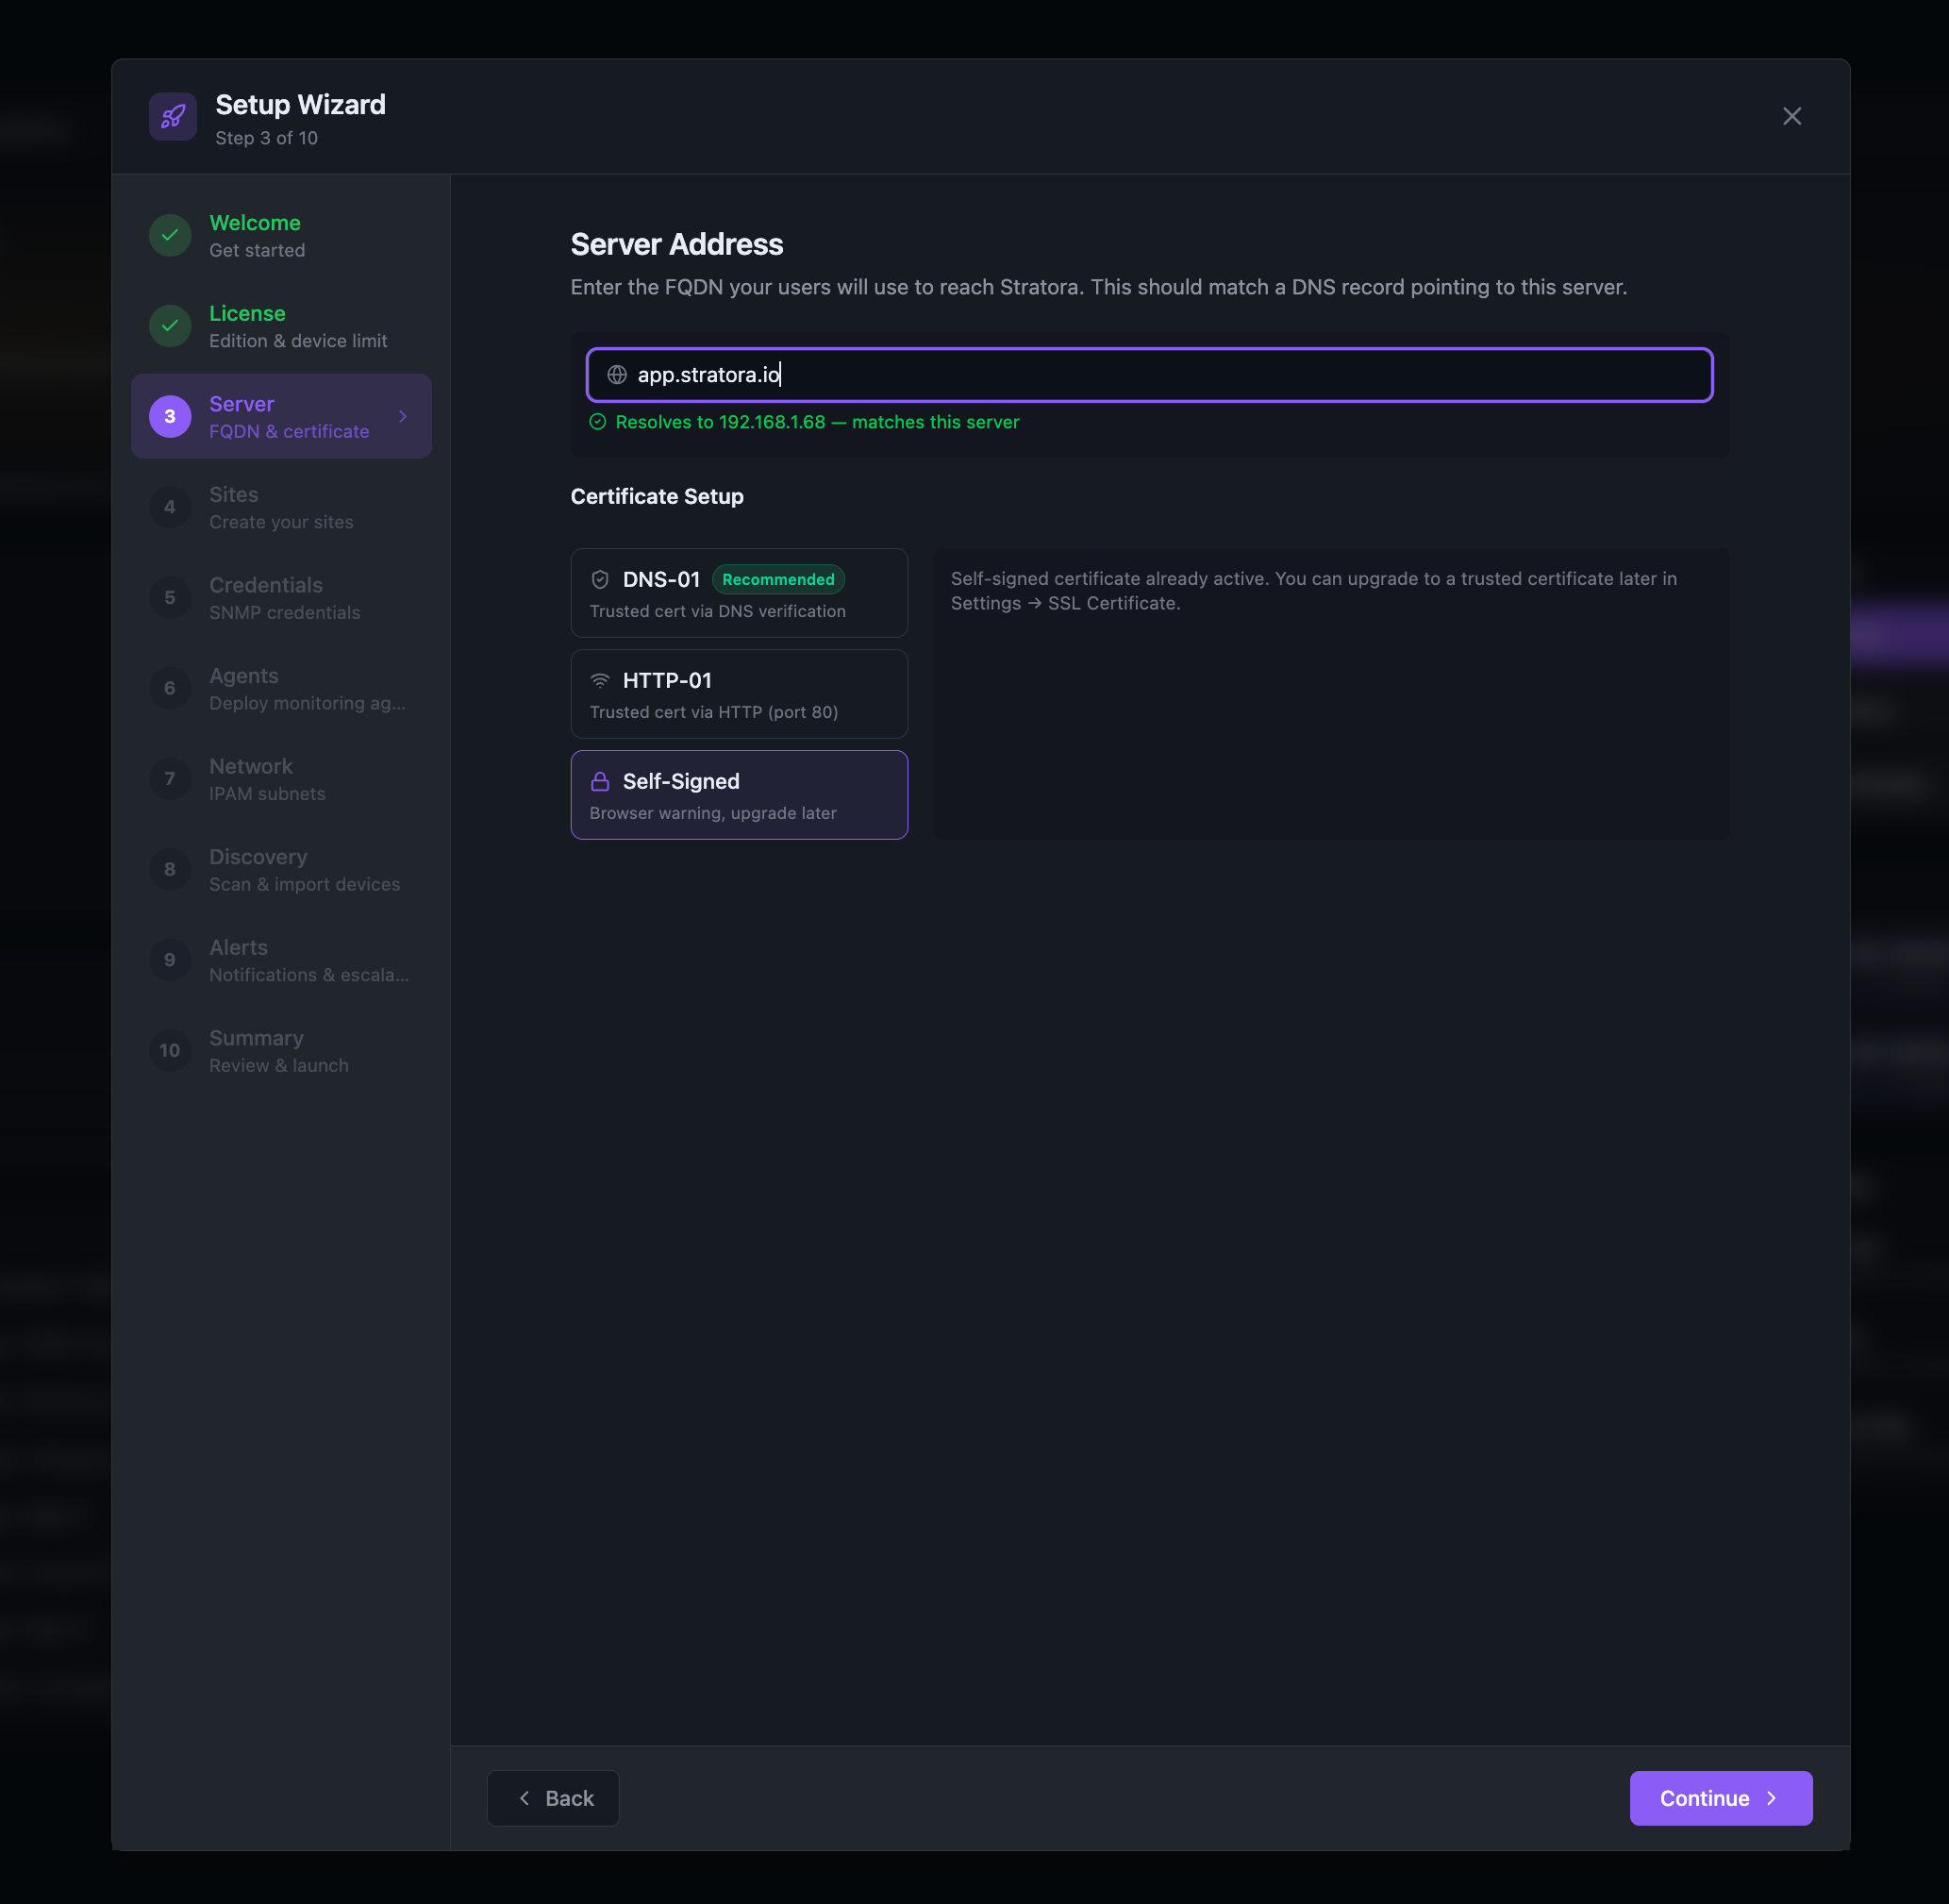
Set the FQDN your users will use to reach Stratora. This must match a DNS A record pointing to the server — Stratora validates the DNS resolution live and confirms it matches the server's IP.
Certificate options:
- DNS-01 (Recommended) — Automated Let's Encrypt certificate via DNS verification. Select your DNS provider (Cloudflare, Route 53, GoDaddy, and Namecheap supported), enter your API token and Let's Encrypt email, then click Issue Certificate.
- HTTP-01 — Let's Encrypt via HTTP challenge on port 80. Requires port 80 to be reachable from the internet.
- Self-Signed — Generates a self-signed certificate immediately. Browsers will show a warning. You can upgrade to a trusted certificate later in Settings → SSL Certificate.
Step 4: Sites
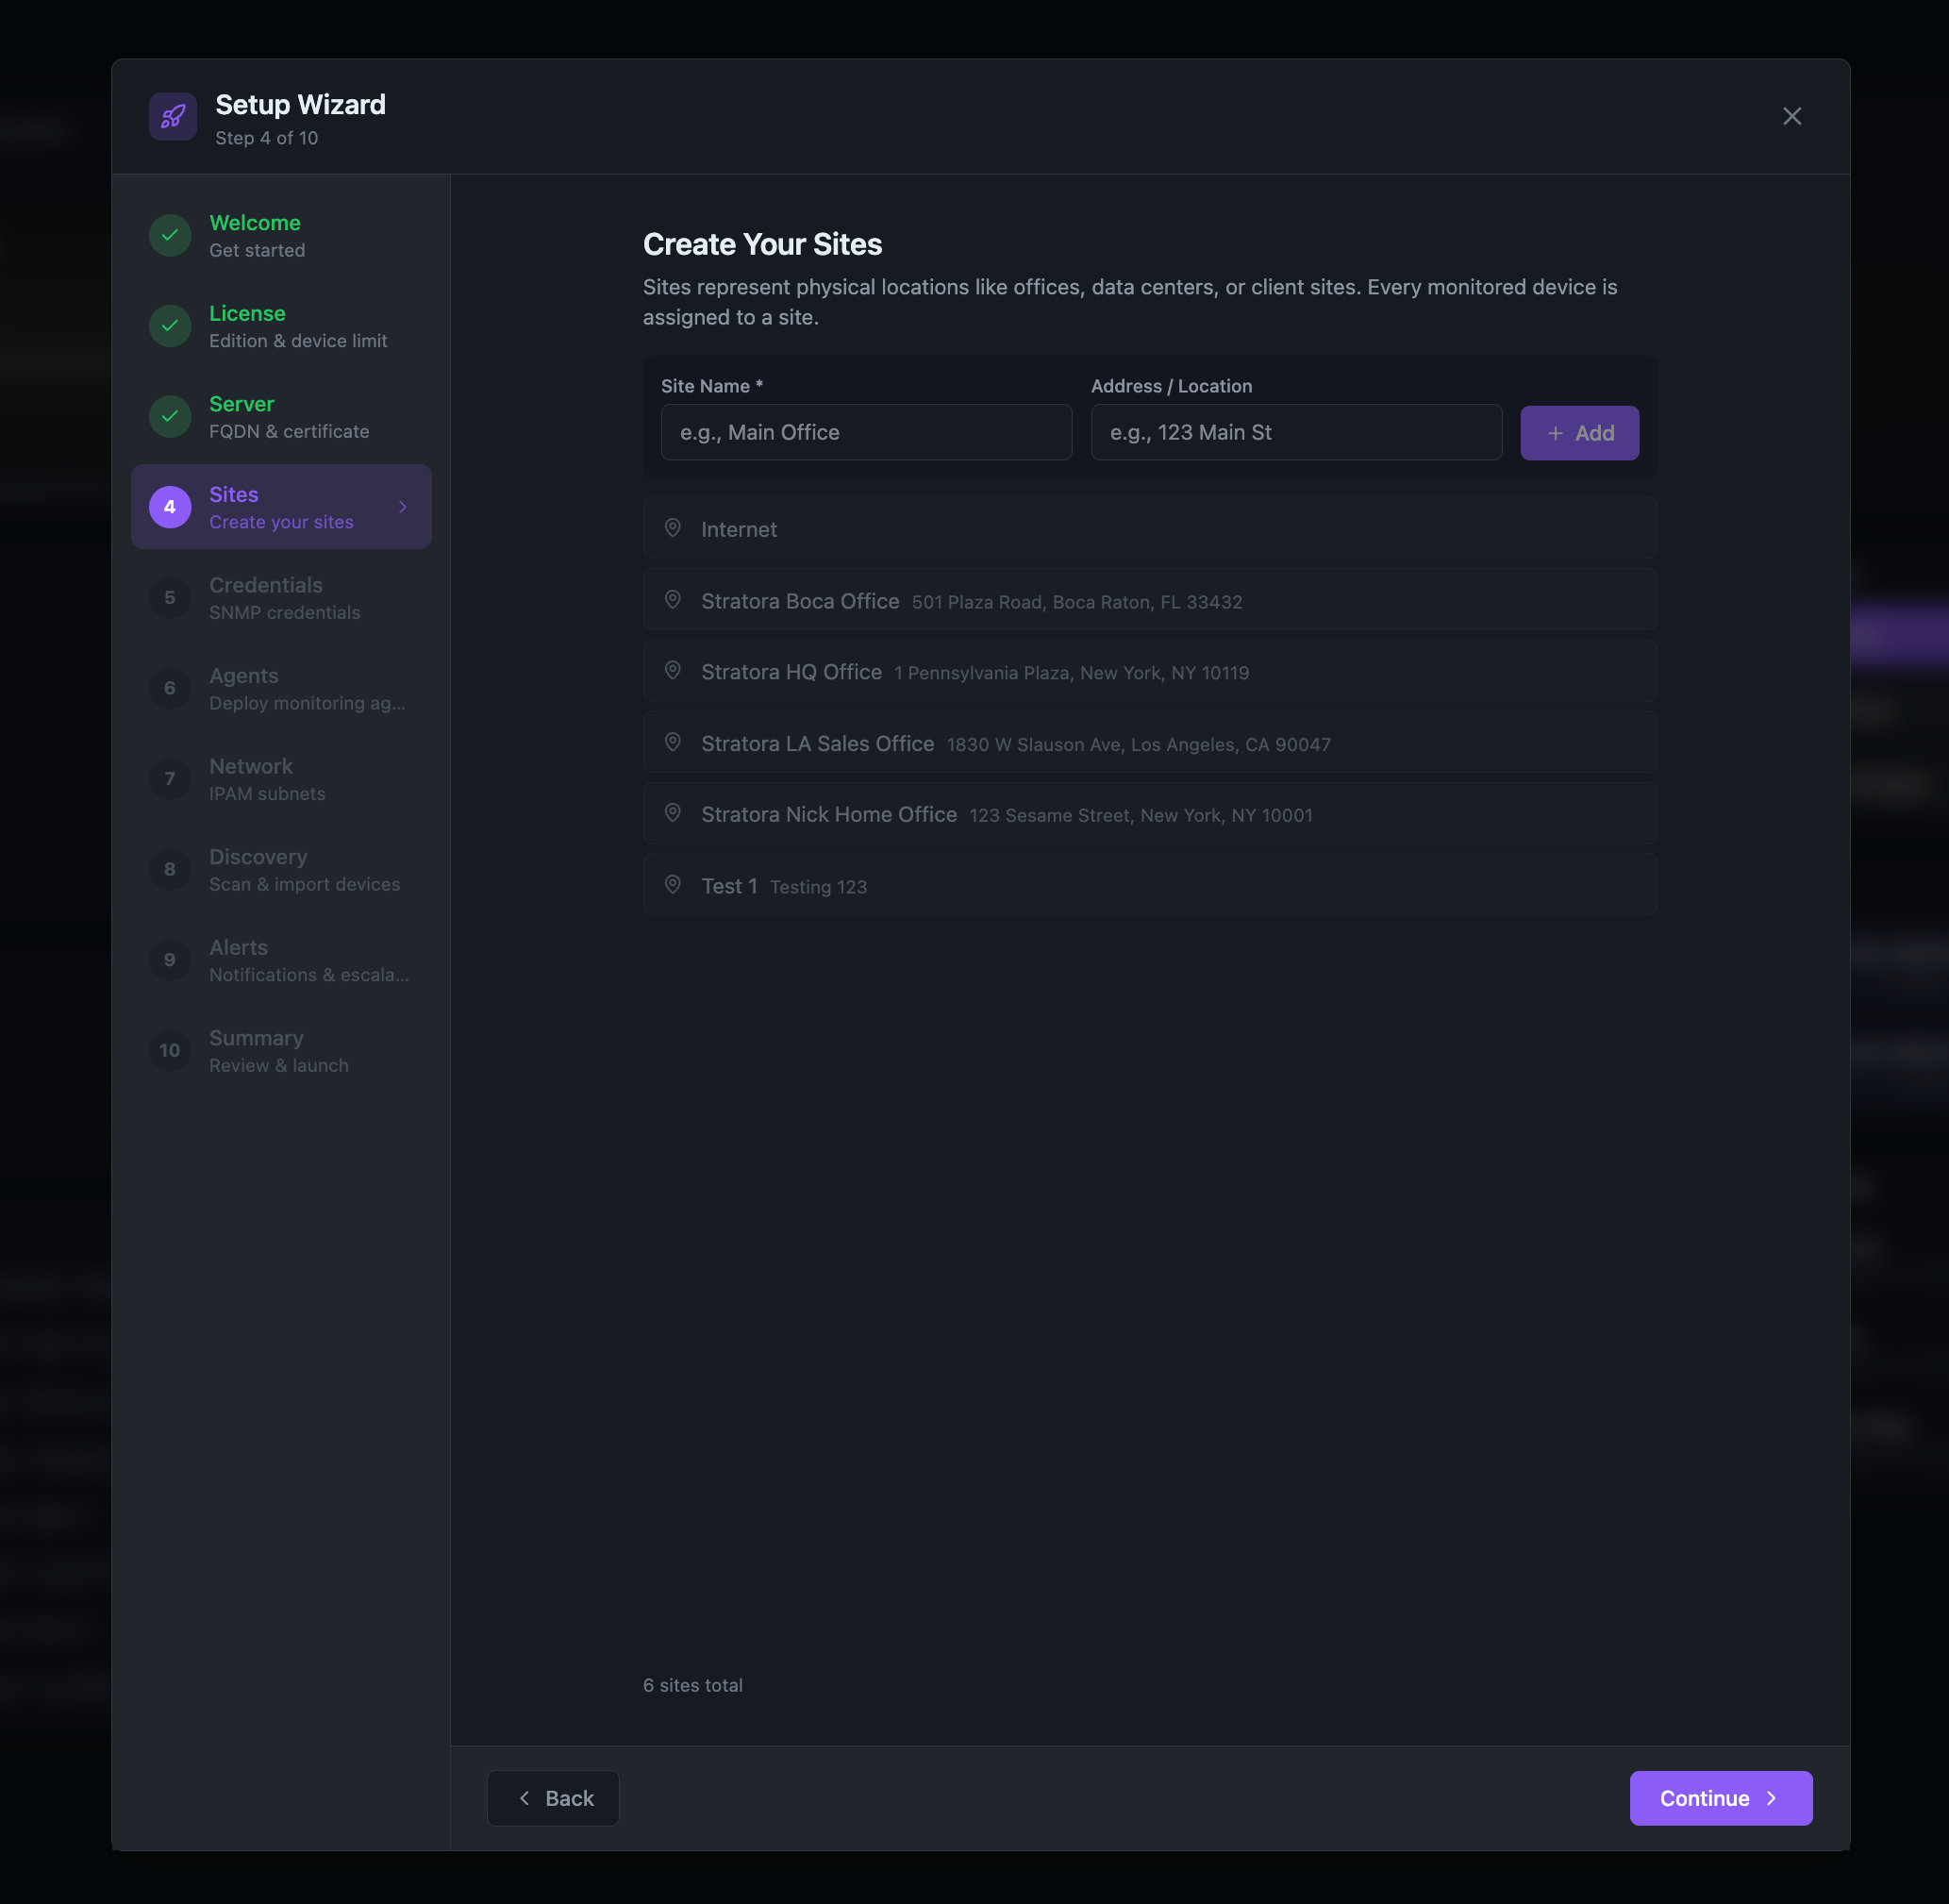
Sites represent your physical locations — data centers, branch offices, factory floors, or client environments. Every monitored device belongs to a site.
- Enter a Site Name (e.g., "HQ Data Center", "Boca Raton Office")
- Optionally add an Address for geographic mapping
- Click Add to create the site
- Create at least one site to continue (you can add more later)
Sites created here automatically get dashboards, topology maps, and health scoring. No manual dashboard setup required.
Step 5: Credentials
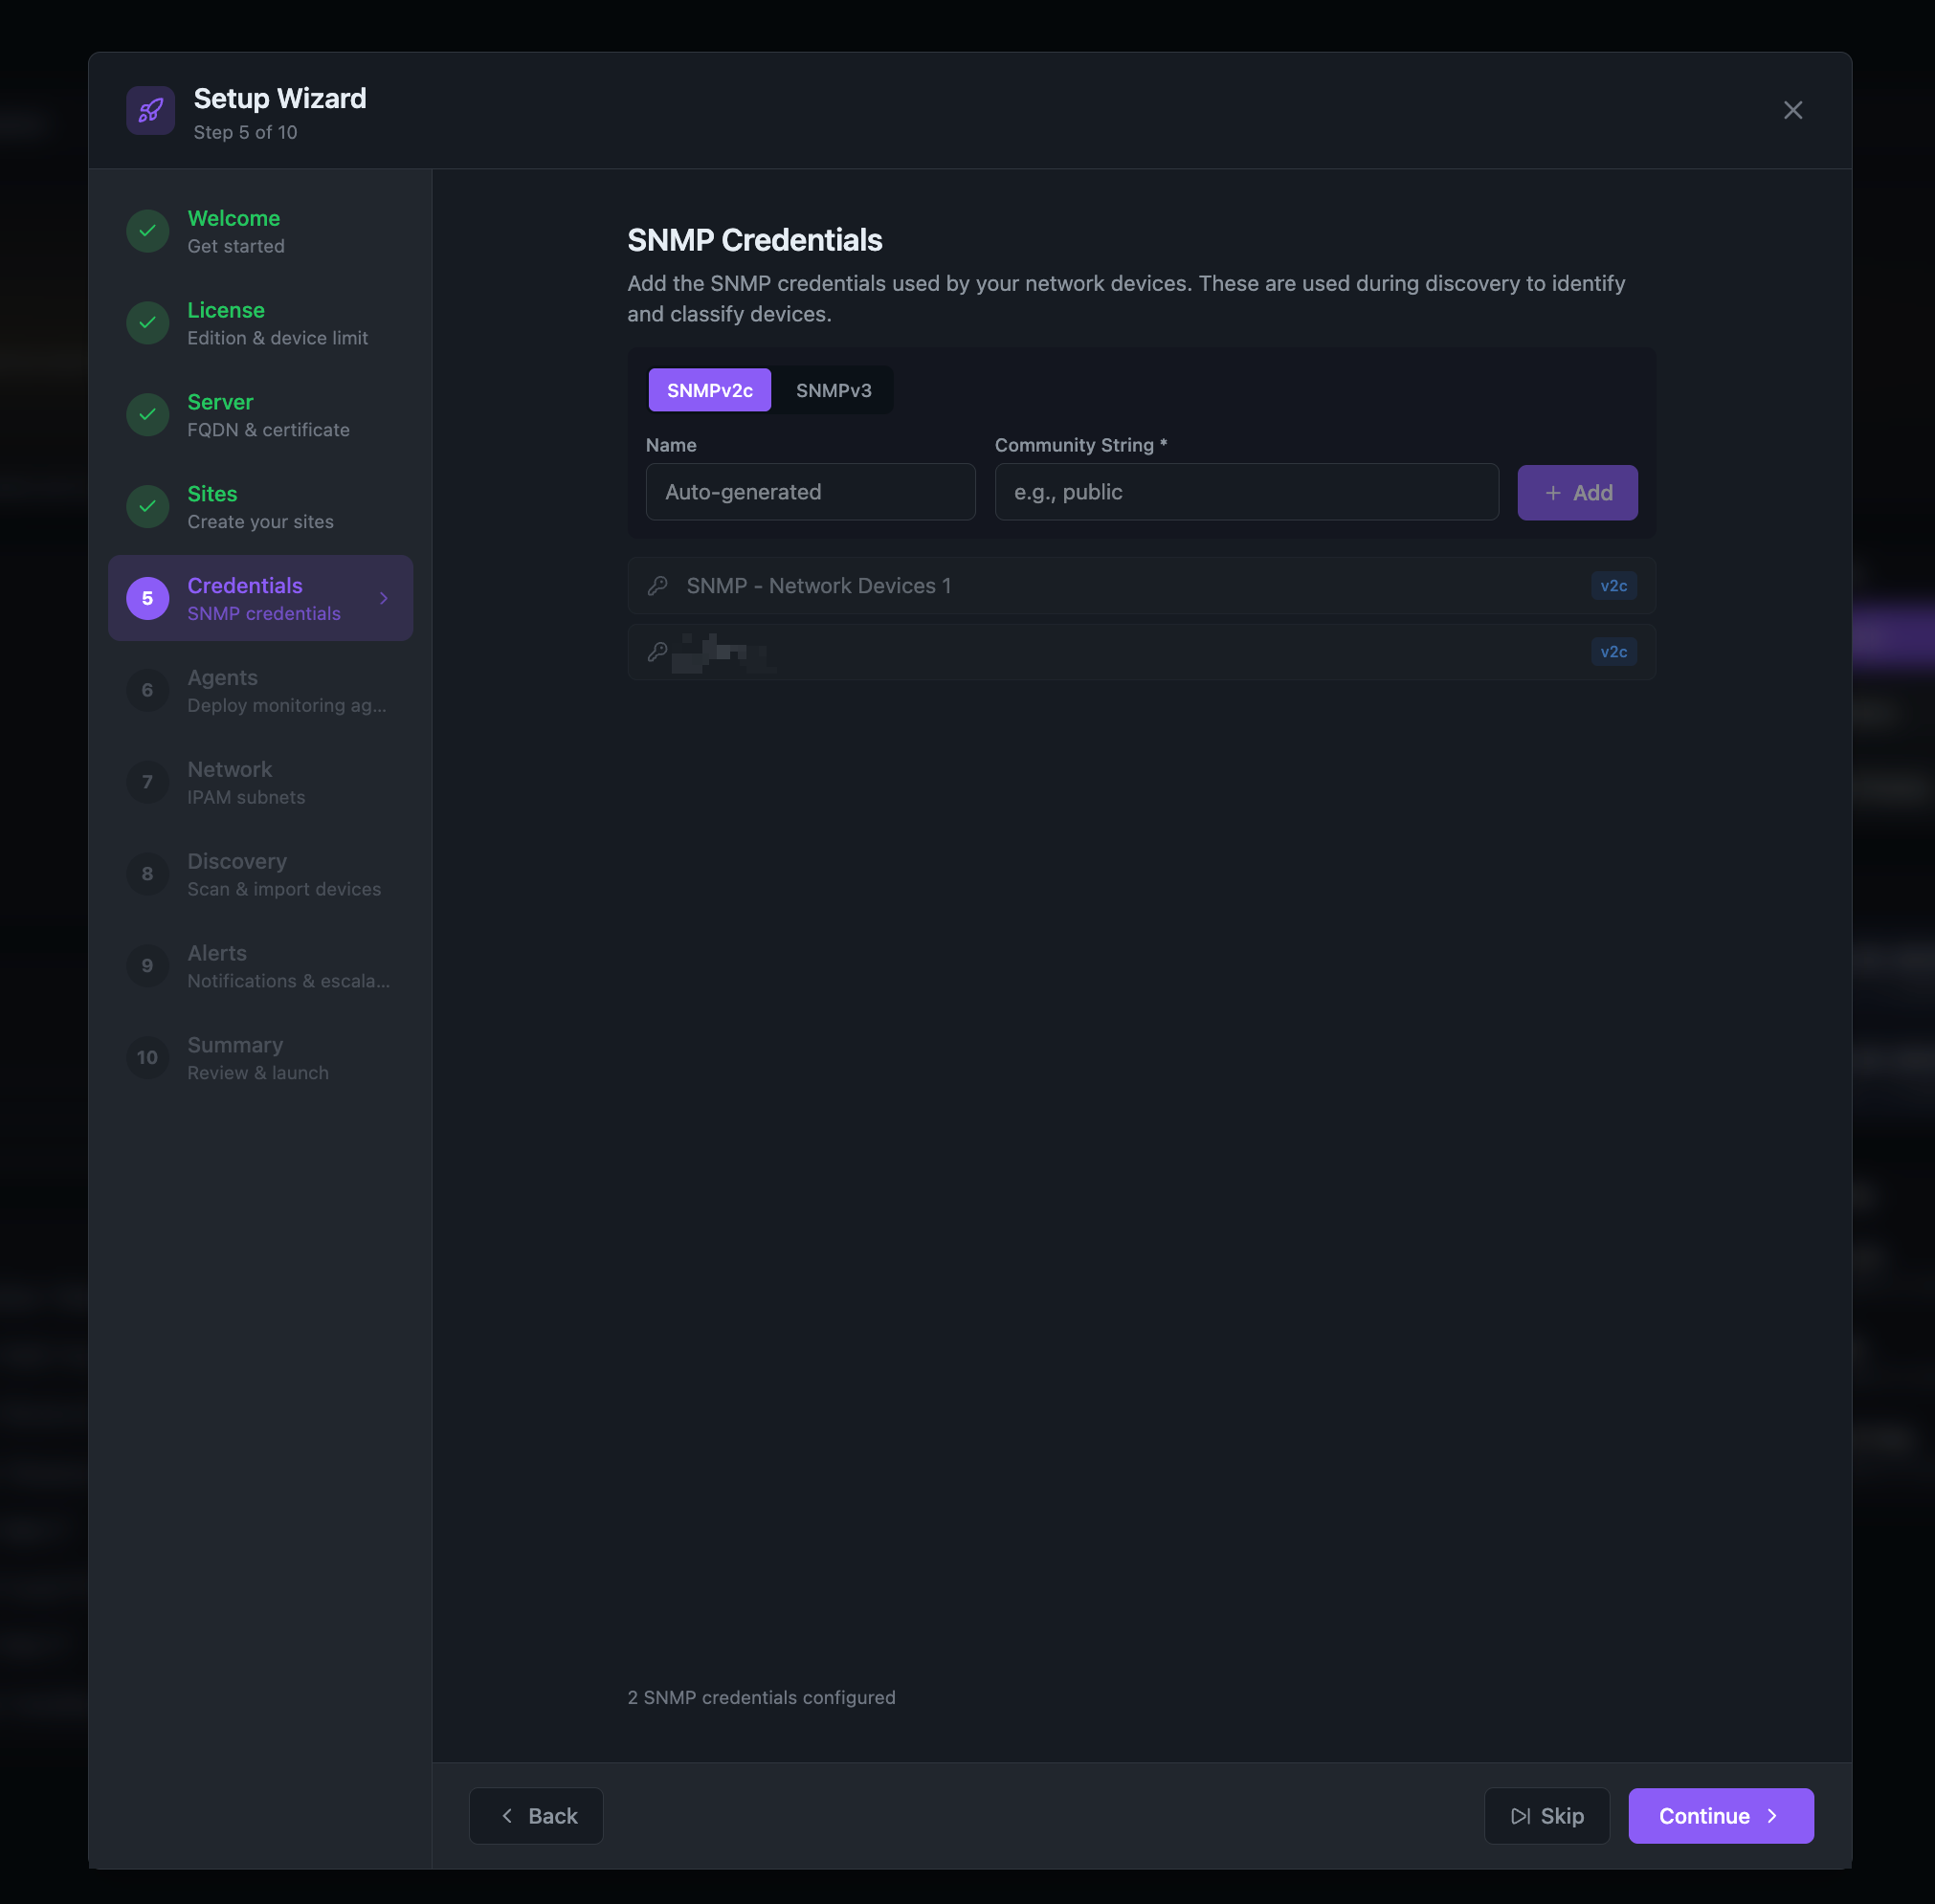
Provide your SNMP credentials so Stratora can automatically identify, fingerprint, and classify every device on your network. These are stored in an encrypted credential vault.
For SNMP v2c:
- Enter the community string (e.g.,
publicfor read-only)
For SNMP v3:
- Enter the username, security level, and authentication/privacy protocols and passwords
You can add multiple credentials — during discovery, Stratora tries each credential sequentially per device and uses the first one that succeeds.
This step is skippable if you plan to monitor agent-based devices only.
Step 6: Agents
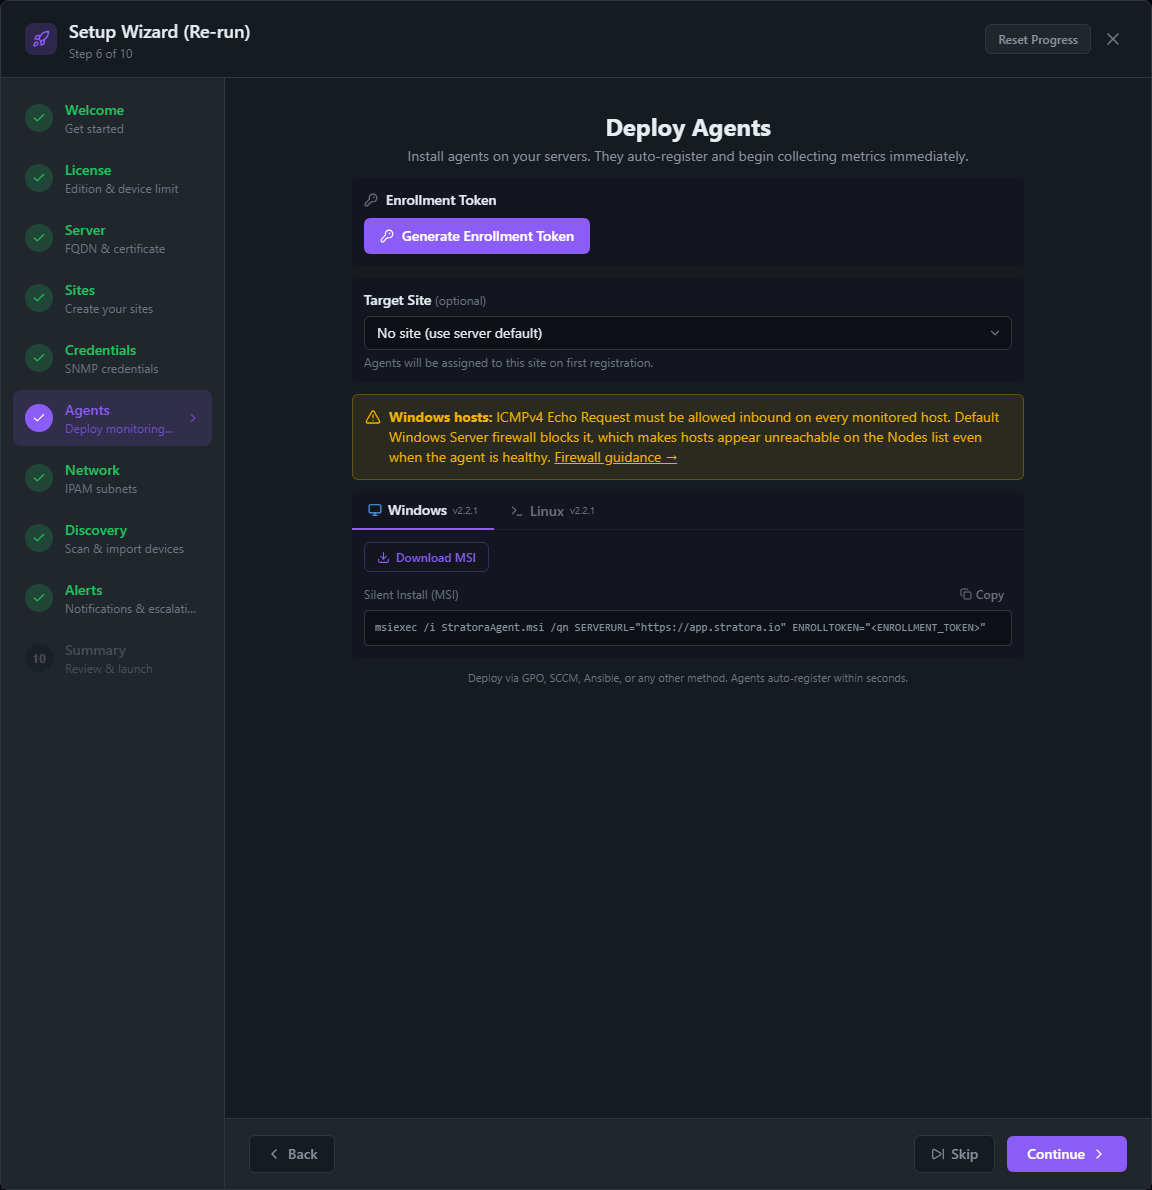
Deploy Stratora agents to Windows and Linux servers for deep OS-level monitoring (CPU, memory, disk, services, processes).
- Click Generate Token to create an enrollment token
- Optionally select a Site to auto-assign enrolled agents
- Follow the on-screen instructions — the wizard generates the install commands for you and provides direct download links for the installer packages
- Deploy to your servers using the provided commands, or distribute the installers via GPO, SCCM, Intune, Ansible, or any other deployment tool
Linux tab:
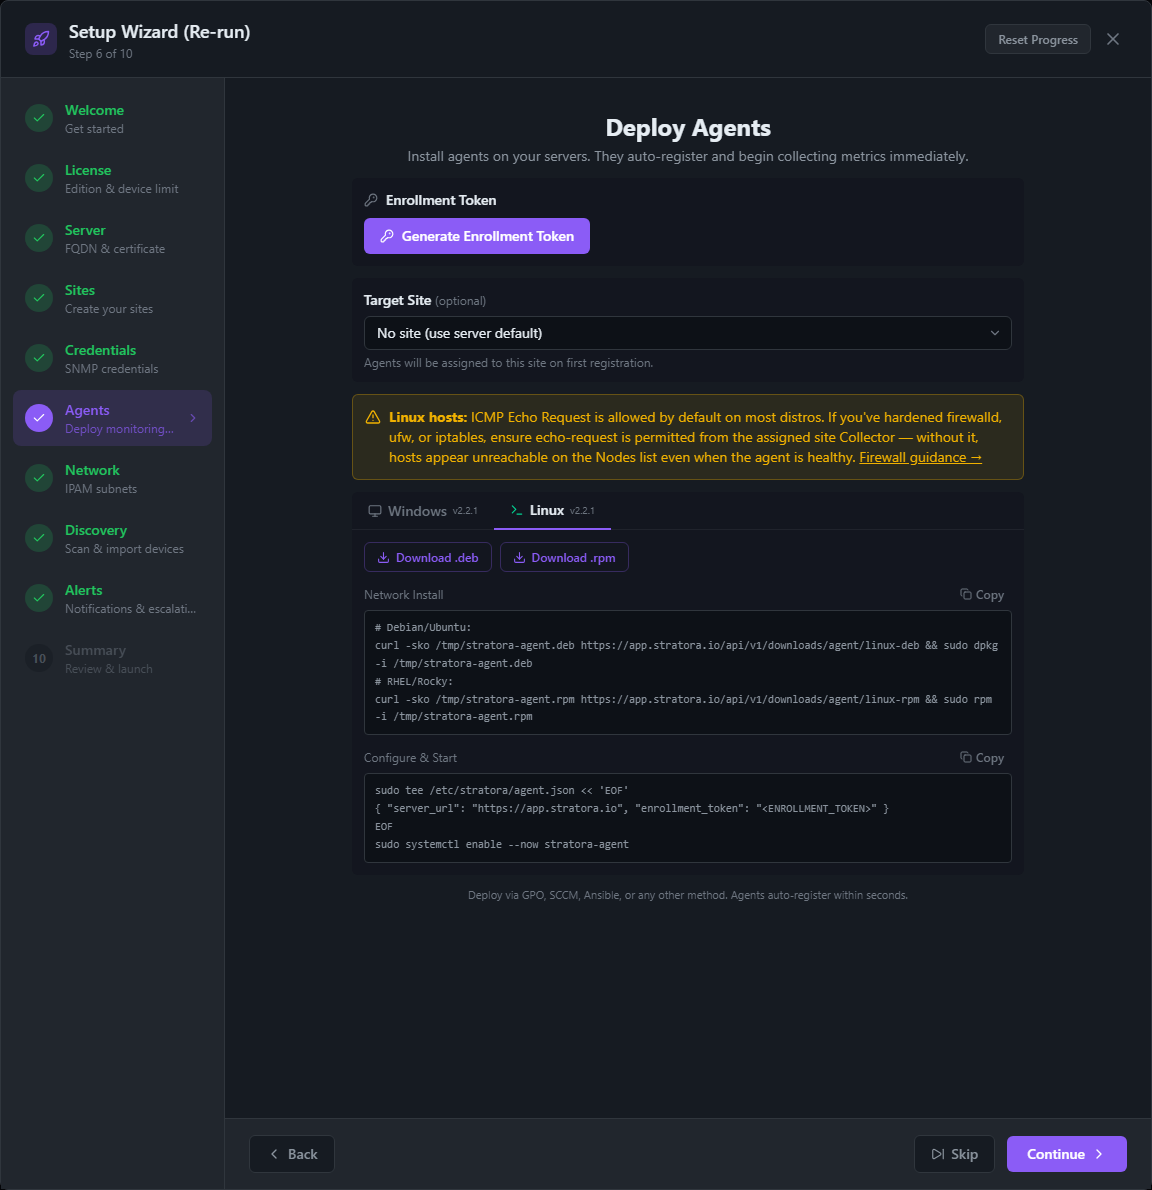
Agents enroll automatically and begin reporting metrics within seconds (typically under 60). This step is skippable — you can deploy agents later.
Step 7: Network (IPAM Subnets)
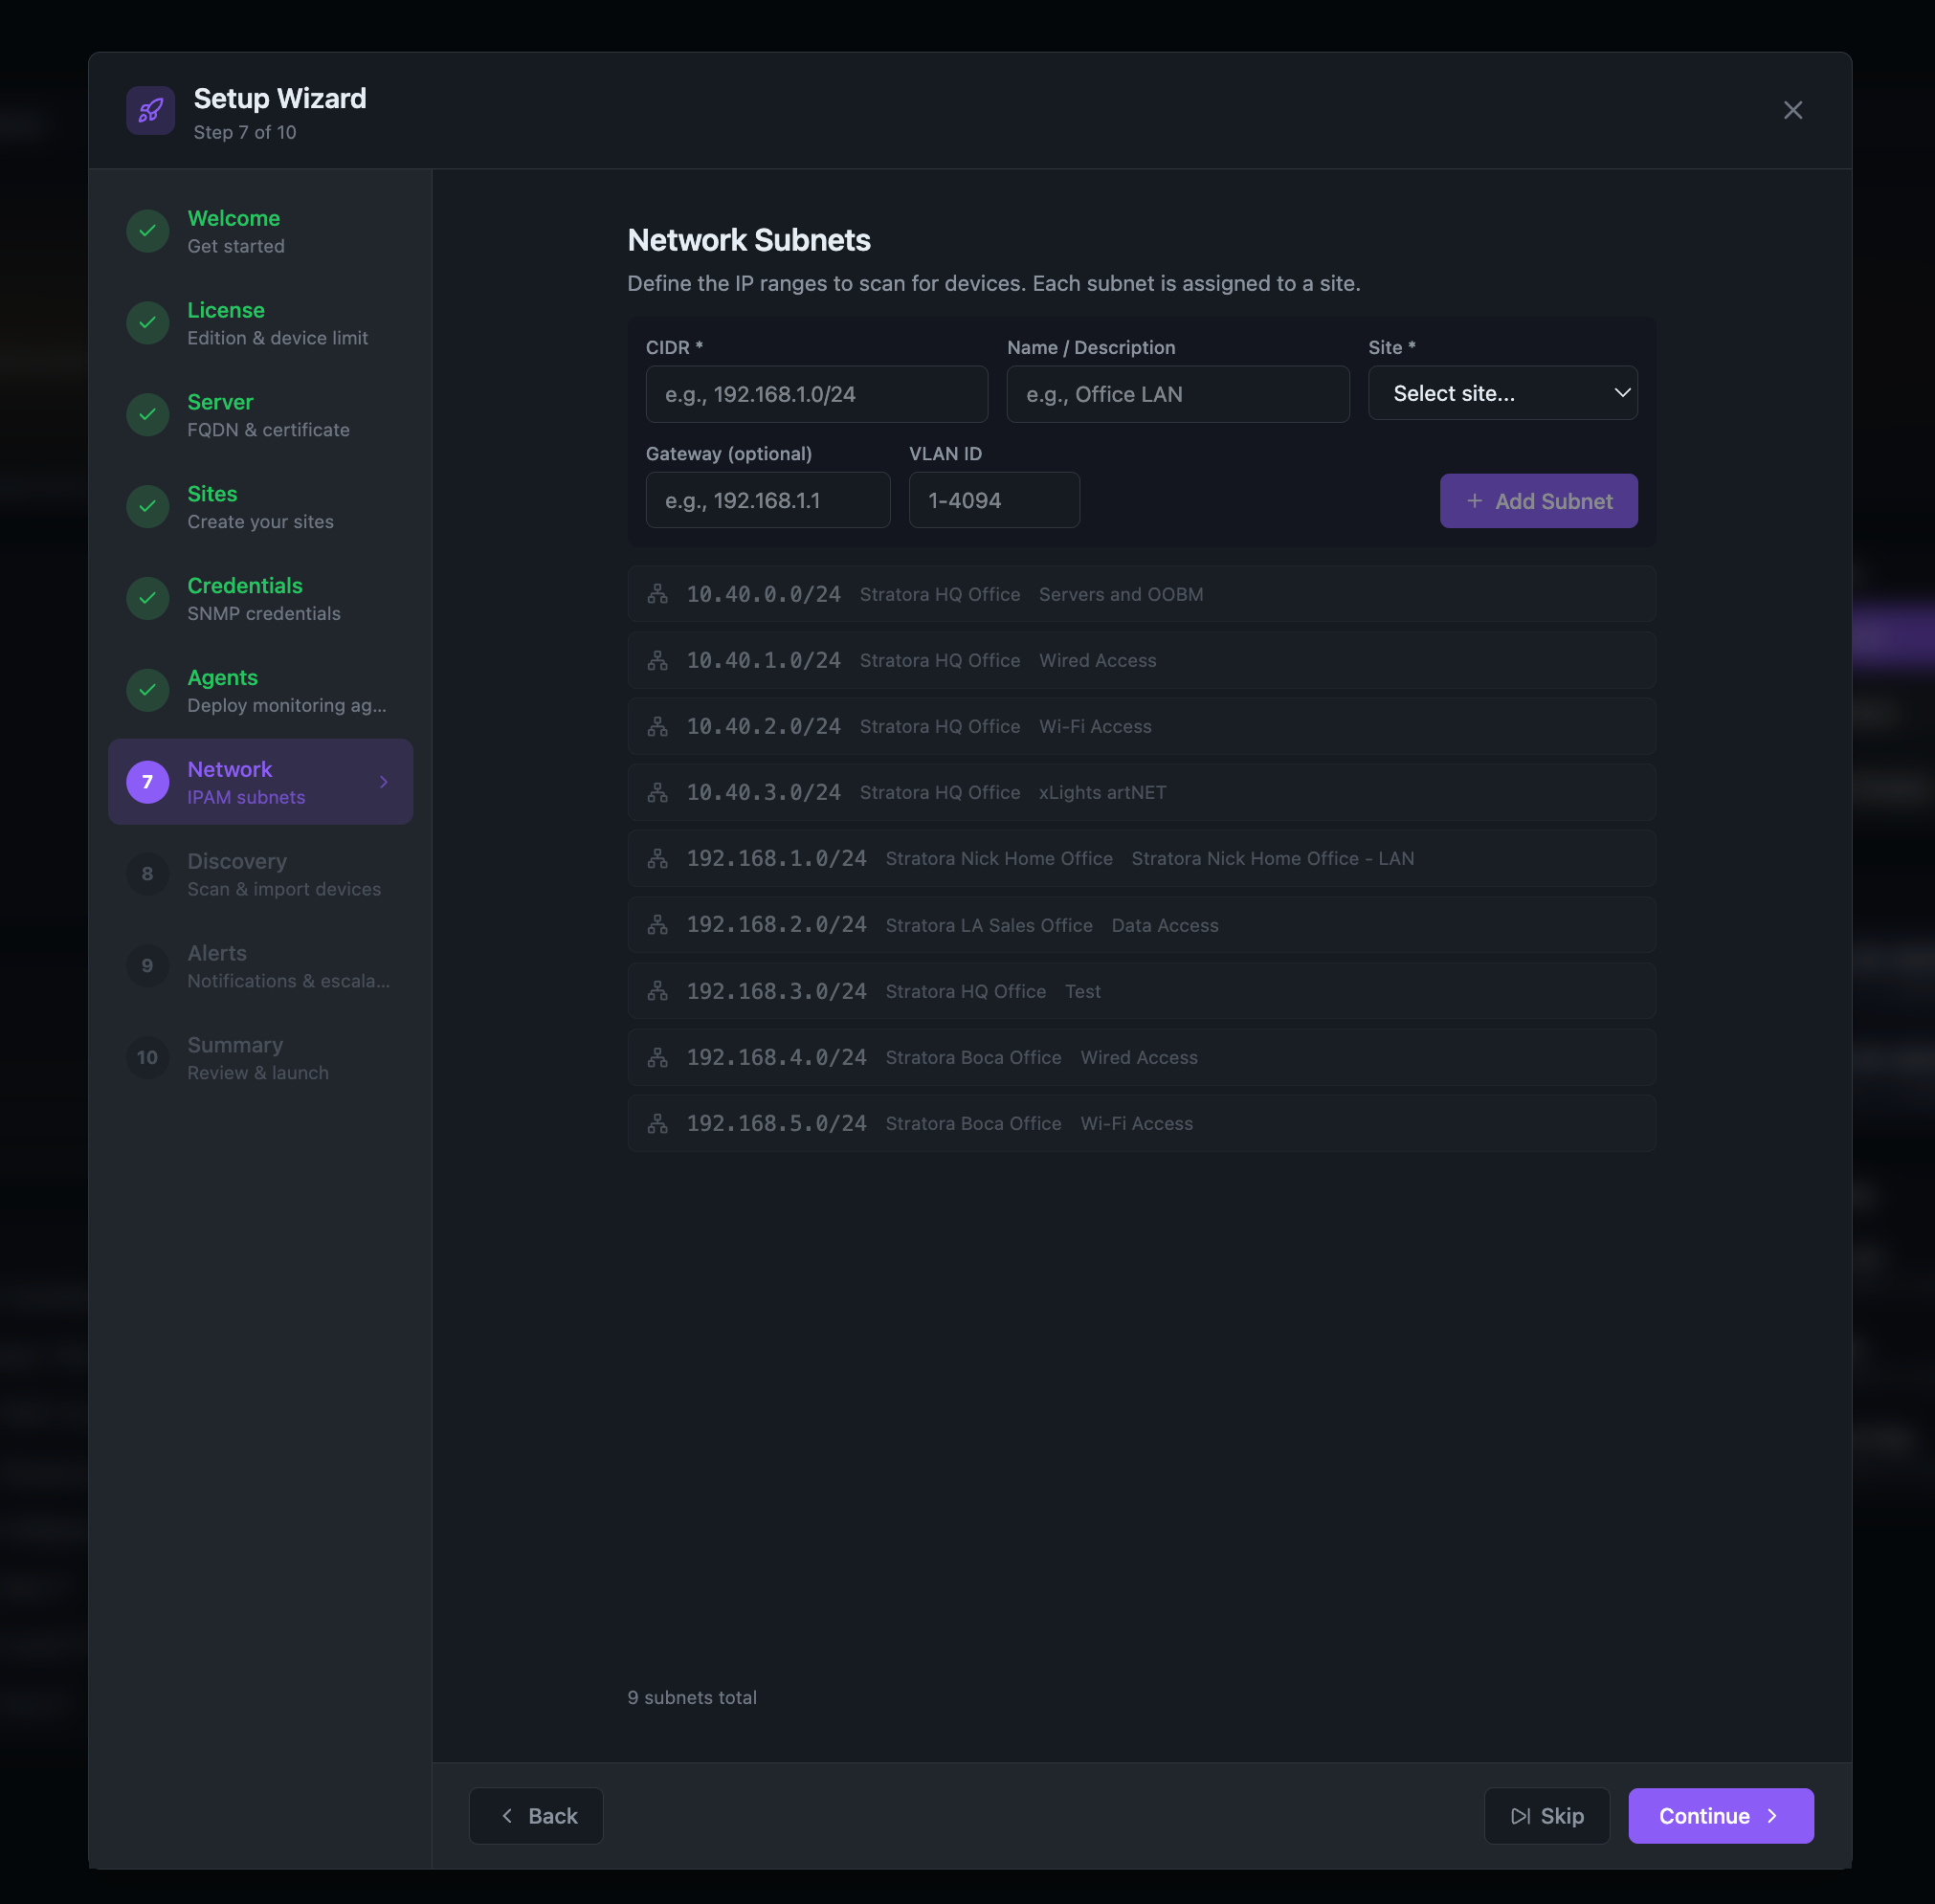
Define the IP ranges to scan. Stratora will do the rest — scanning every address, identifying live hosts, and classifying devices automatically. These are used for discovery scanning and IPAM tracking.
- Enter a CIDR (e.g.,
10.40.0.0/24) - Assign a Site
- Optionally add a Name, Gateway, and VLAN ID
- Click Add
Add all subnets you want to scan. The discovery step will use these as scan targets.
This step is skippable if you only plan to monitor agent-based devices.
Step 8: Discovery
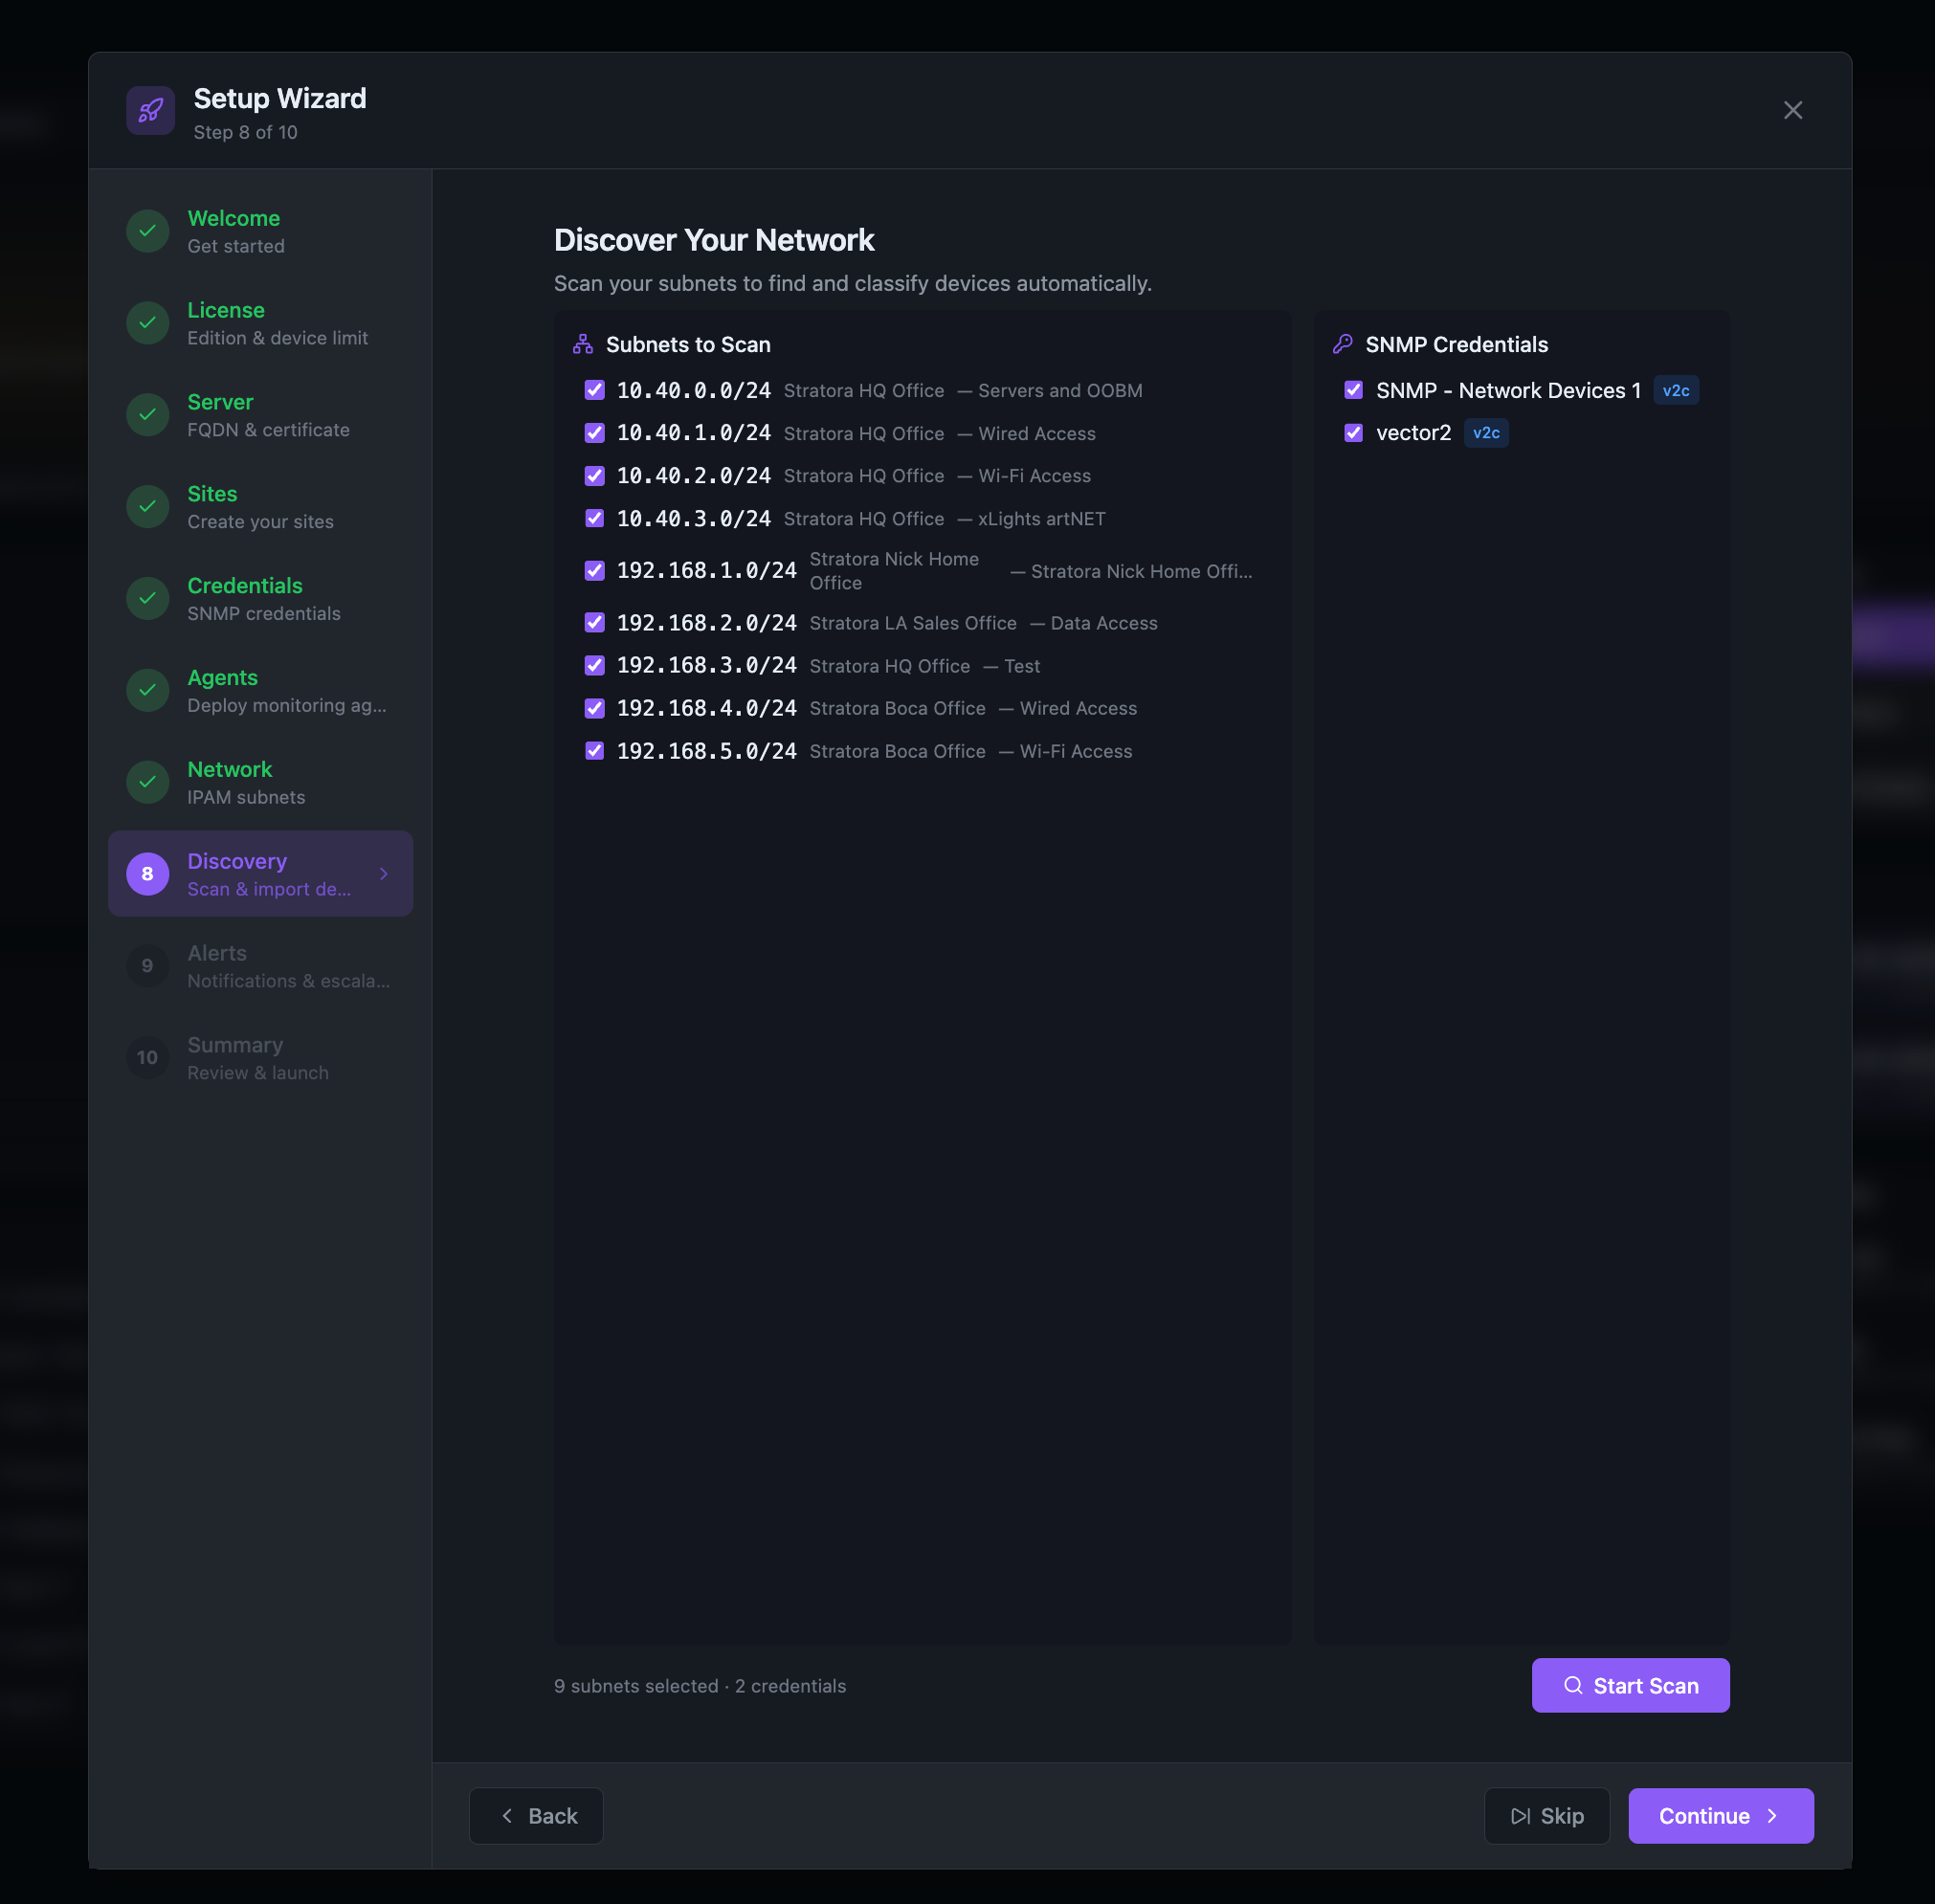
This is where Stratora scans your network and finds devices automatically.
Configure: Your subnets from Step 7 and credentials from Step 5 are pre-selected. Adjust if needed, then click Start Scan. Stratora handles everything from here.
Scan: Stratora scans all IP addresses in your selected subnets using ICMP ping, TCP port probing, and SNMP queries. Devices appear in the results table as they're discovered. Within under a minute, discovered devices begin appearing in real time as the scan progresses. The scan typically takes 5–10 minutes for a few /24 subnets.
Each discovered device is classified automatically:
- High confidence — SNMP-responding devices with full identification (firewalls, switches, APs, NAS, servers)
- Medium confidence — Devices with a hostname or open ports but no SNMP
- Low confidence — ICMP-only responses (often proxy ARP phantoms from firewalls)
After the scan completes:
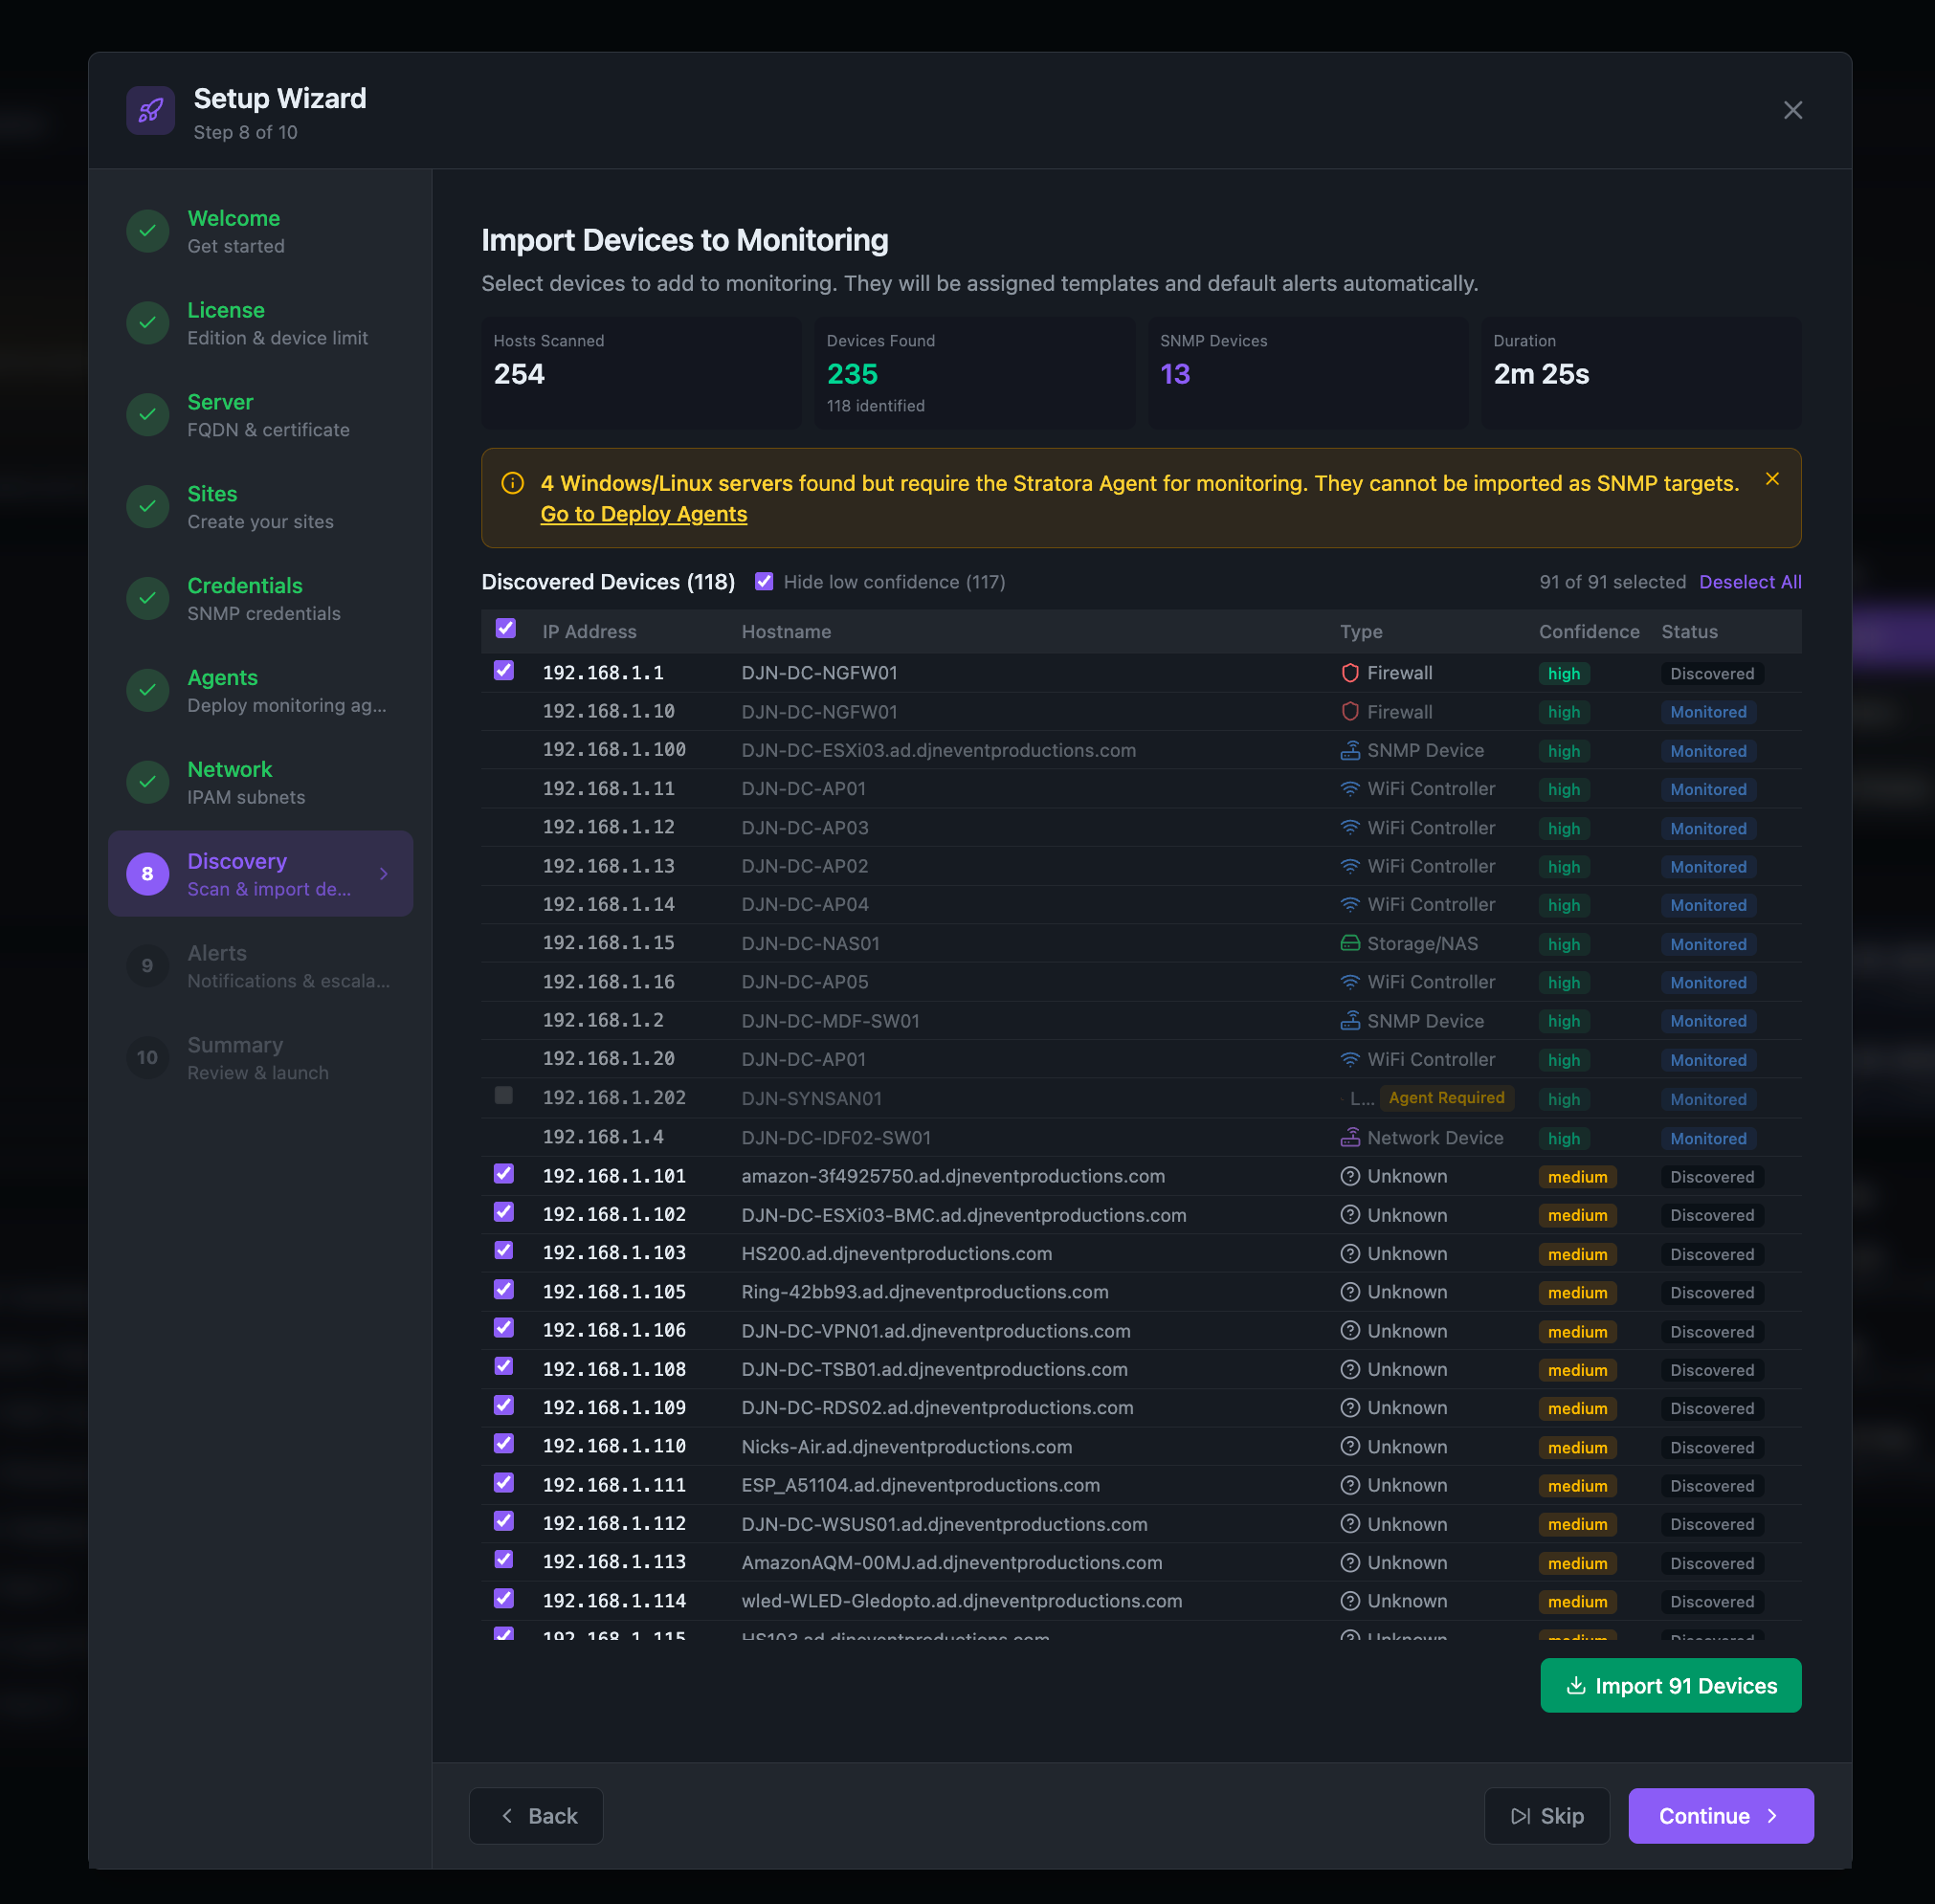
Import: Review the results. Devices are pre-selected based on confidence level. Click Import Devices to add them to monitoring. Imported devices are immediately assigned monitoring templates, dashboards, and default alert rules based on their device type — no manual configuration required.
This step is skippable if you prefer to add devices manually.
Step 9: Alerts & Escalation
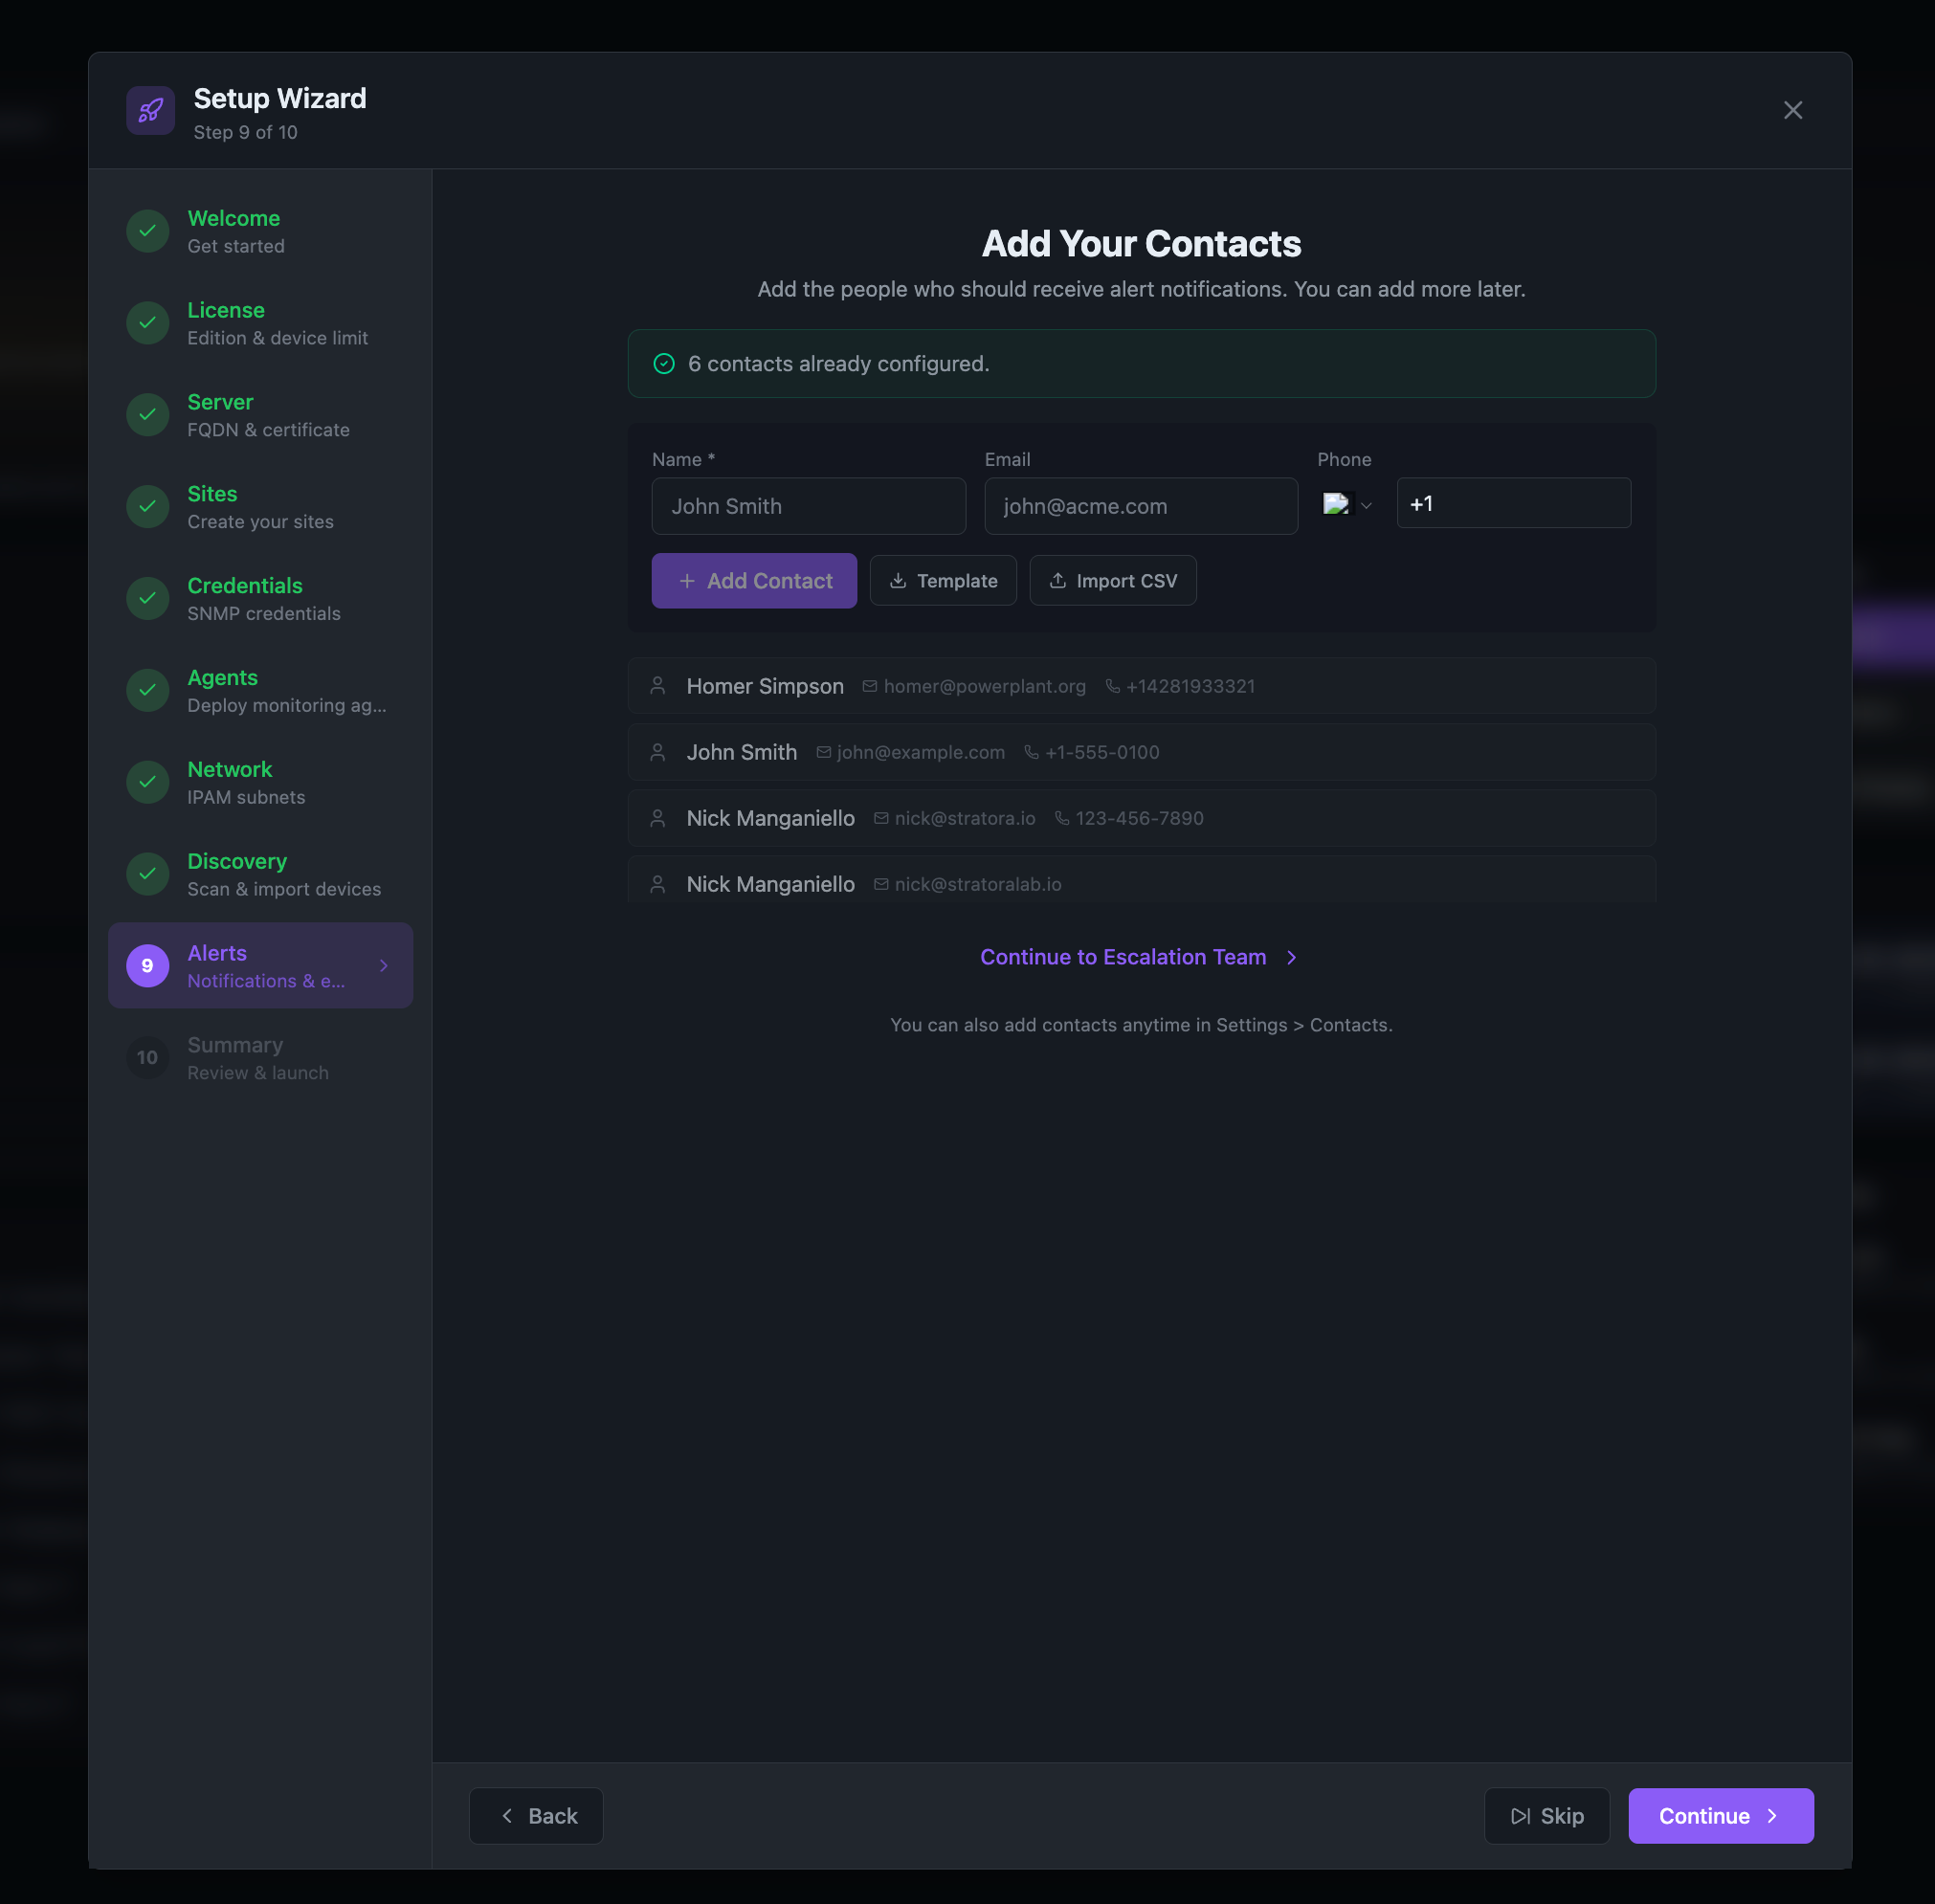
Start by adding your notification contacts — the people who should receive alerts when something goes wrong. Enter a Name, Email, and optionally a Phone number for each contact. You can add contacts individually with Add Contact, use a Template, or bulk-import via Import CSV.
Once your contacts are added, click Continue to Escalation Team to open the escalation team builder:
Team Details: Name your team (e.g., "Network Operations", "IT On-Call").
Schedule: Choose how the team operates:
- Always Active — Notifications fire 24/7 to configured channels
- Time-Based — Notifications only during specified hours and days
- On-Call Rotation — Notifications route to whoever is currently on-call. Define your rotation roster (team members in order), rotation period (e.g., 7 days), and handoff time.
Notification Steps: Configure escalation tiers:
- Step 1 (Immediate): Notify via email, Slack, Teams, or webhook
- Step 2 (after delay): Escalate to additional contacts if unacknowledged
- Add as many steps as needed
For rotation teams, escalation steps can target rotation positions:
- On-Call #1 is whoever is currently on-call right now.
- On-Call #2 is whoever is next in line after the rotation handoff.
These targets are evaluated at alert time, so the same step always notifies the right person as the rotation cycles. See Escalation Teams → On-Call Rotation for details.
Settings: Configure repeat cycle behavior for unacknowledged alerts.
Review: Confirm the configuration and create the team.
This step is skippable — you can configure escalation teams later from Alerting → Escalation Teams.
Step 10: Summary
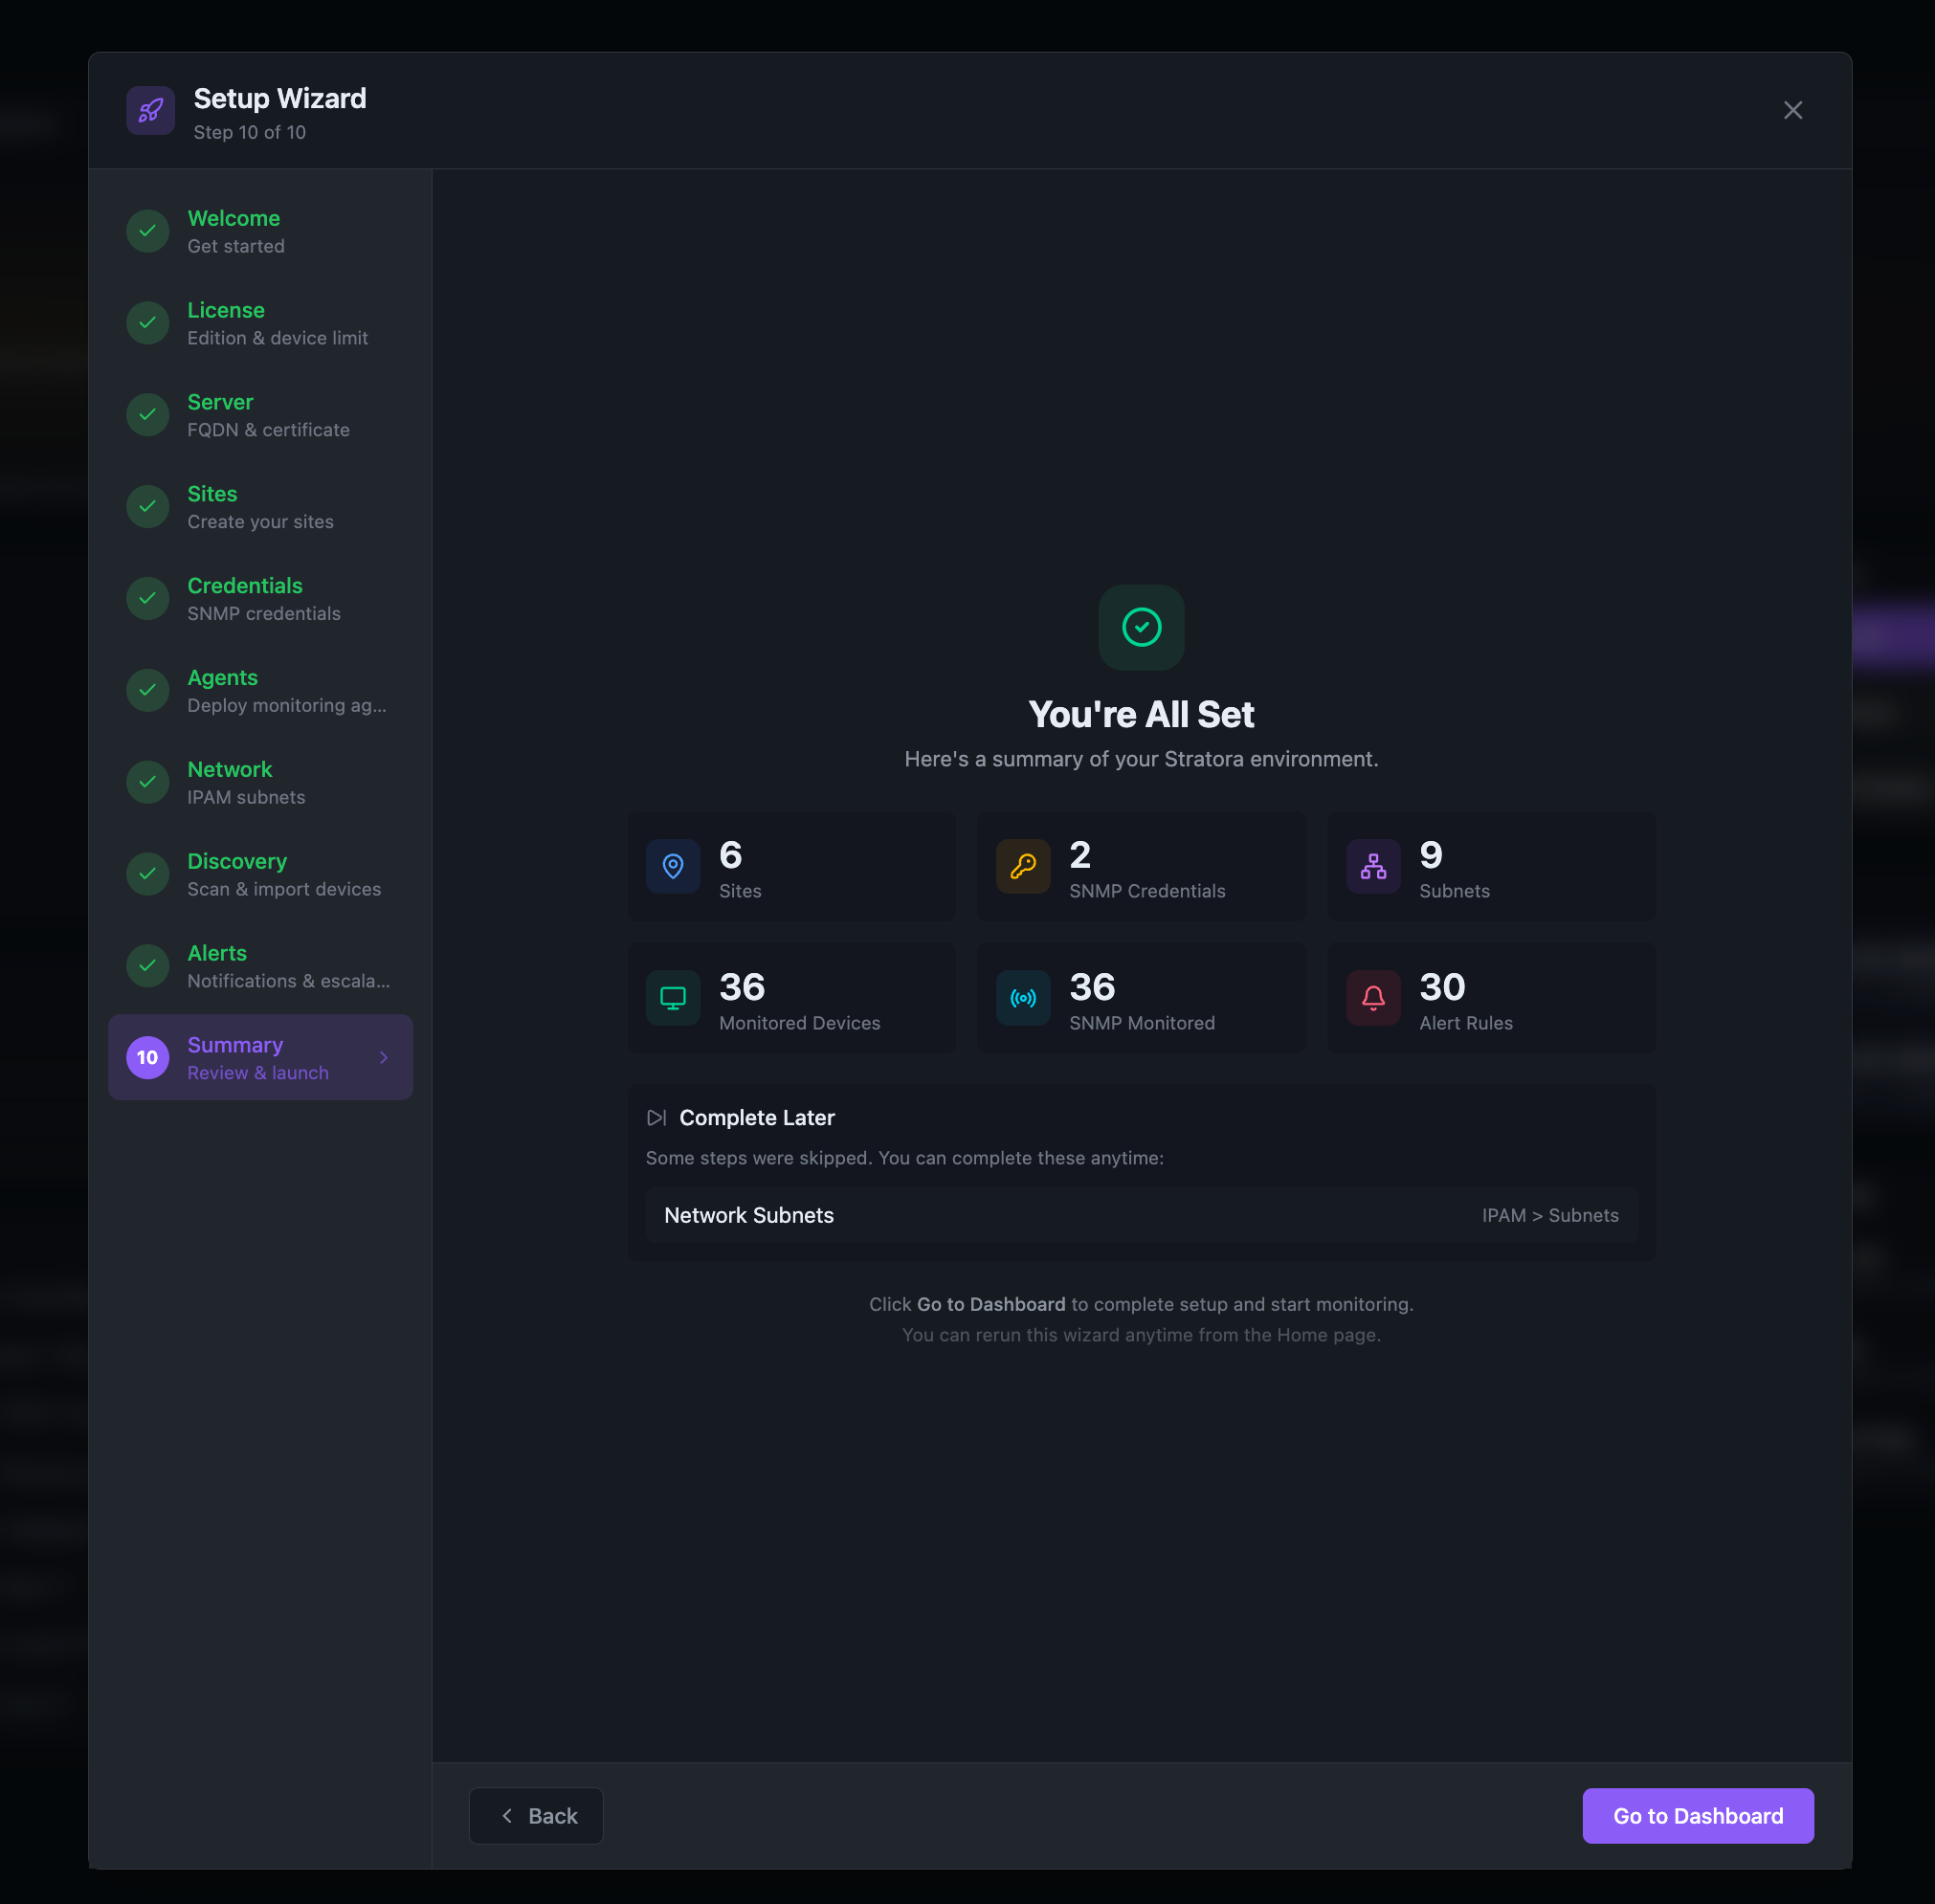
The summary shows your configured environment at a glance: sites, credentials, subnets, monitored devices, and alert rules. If you skipped any steps, a Complete Later section lists them with direct links to the relevant settings pages where you can finish configuration at any time. Click Go to Dashboard — your infrastructure is now live.
After Setup
At this point, your infrastructure is live. Stratora has discovered your devices, generated site dashboards and topology maps, assigned monitoring templates, and activated alert rules — all automatically. No manual dashboards, alert rules, or templates were required to reach this point. What follows is a brief orientation to what you now have.
Home Dashboard
Your Home page now shows the Infrastructure Brief — a triage-oriented overview with:
- Health Score trending across your environment
- Critical Impact alerts requiring immediate attention
- Resource Risk warnings (disk space, CPU, memory trends)
- Recommended Actions — deterministic suggestions based on your environment state
Site Dashboards
Each site gets an auto-seeded dashboard with panels for node health, service status, and network topology. Navigate to a site to see its dedicated view.
Adding More Devices
As your environment grows:
- Re-run the wizard from the Home page to add more sites, subnets, or credentials
- Run discovery scans from Collection → Discovery Jobs for ad-hoc network scanning
- Schedule recurring scans from Infrastructure → IPAM to automatically detect new devices
- Deploy agents to additional servers using an enrollment token from Collection → Enrollment API
Monitoring Configuration
Stratora auto-assigns monitoring templates based on device type. To customize:
- Dashboard templates — Edit auto-created dashboards or build custom ones
- Alert rules — Modify default thresholds in Alerting → Alert Configurations
- Escalation policies — Add teams, adjust delays, and configure on-call schedules in Alerting → Escalation Teams
Manual Setup (Without Wizard)
If you prefer to configure everything manually or skipped the wizard:
- Create sites in Infrastructure → Sites
- Add SNMP credentials in Collection → Credentials
- Define subnets in Infrastructure → IPAM
- Run a discovery scan in Collection → Discovery Jobs — select subnets and credentials, start the scan, then import discovered devices
- Deploy agents using enrollment tokens from Collection → Enrollment API (install commands are also available from Collection → Agents)
- Create escalation teams in Alerting → Escalation Teams
- Configure alert rules in Alerting → Alert Configurations
All of these capabilities are the same ones the wizard orchestrates — the wizard just sequences them for a streamlined first-run experience.