Alert Configurations
An alert configuration is a rule that tells Stratora when to fire an alert — which metric to watch, what condition to check, and what thresholds constitute a warning or critical state.
Stratora has two kinds of alert configurations that are managed together in a single unified view.
Built-In Configurations
Stratora ships with a catalogue of built-in alert configurations that cover the most common monitoring scenarios. They span four categories — see the in-product Alert Configurations page for the complete current list, including thresholds and durations.
| Category | What It Monitors | Examples |
|---|---|---|
| Metric | A numeric metric value against a threshold (CPU, memory, disk, latency, etc.) | High CPU Usage, High Memory Usage, Low Disk Space, SSL Certificate Expiring |
| Service | Whether a Windows or Linux service is running or stopped | Service Stopped |
| Reachability | Whether the node is reachable via ping or agent heartbeat | Node Unreachable, Agent Heartbeat Lost, Collector Offline |
| Interface | Whether a network interface is up or down | Interface Down, High Interface Errors |
Built-in configurations:
- Apply globally — they evaluate against every node in the system.
- Cannot be deleted. They can be enabled or disabled.
- Have a limited editing surface. You can change description, thresholds, duration, escalation team, and the enabled toggle. Name, alert type, metric, condition, and default severity are locked. To customize a built-in beyond that — for example, to use a different metric or change the comparison direction — use Clone to create a custom configuration based on the built-in.
Three out-of-the-box configurations — Agent Heartbeat Lost, Node Unreachable, and Service Stopped — ship enabled but with no escalation team assigned. They will create alerts in the alerts list, but no notifications dispatch until you assign each one to an escalation team. Walk through the Alert Configurations list during initial setup and assign teams to anything you want notifications for.
Custom Configurations
Custom alert configurations let you create your own rules — or duplicate a built-in configuration with different thresholds or a different escalation team for a specific scope. Customs are additive: they evaluate alongside the built-in, not in place of it.
Navigate to Alerting → Alert Configurations and click Add Configuration.
Configuration Fields
| Field | Required | Description |
|---|---|---|
| Name | Yes | Display name for the configuration |
| Alert Type | Yes | metric, service, reachability, or interface |
| Metric | Conditional | The metric to evaluate (required for metric type) |
| Condition | Yes | Comparison operator — see below |
| Warning Threshold | No | Value that triggers a warning alert |
| Critical Threshold | No | Value that triggers a critical alert |
| Duration | No | How long the condition must persist before firing (default: immediate) |
| Scope | Yes | Where this configuration applies — see below |
| Escalation Team | No | Which escalation team handles notifications |
| Enabled | Yes | Whether the configuration is active (default: yes) |
Alert Types
| Type | What It Monitors |
|---|---|
| Metric | A numeric metric value against a threshold (CPU, memory, disk, latency, etc.) |
| Service | Whether a Windows or Linux service is running or stopped |
| Reachability | Whether the node is reachable via ping or agent heartbeat |
| Interface | Whether a network interface is up or down |
Conditions
| Condition | Operator | Example |
|---|---|---|
| Greater than | > | CPU usage > 90% |
| Less than | < | Free disk space < 10 GB |
| Equals | = | Service state = stopped |
| Not equals | != | Interface status != up |
For metric configurations, only greater than and less than drive evaluation — the configuration editor for metric alert types reflects this. For service, reachability, and interface configurations, the condition column is metadata used for display; the underlying state-match (e.g. service running vs stopped) is determined by the alert type itself, not the condition value.
Duration
The duration field controls how long a condition must persist before an alert fires. This prevents transient spikes from generating noise.
- Immediate (0 seconds) — fires as soon as the condition is detected
- 5 minutes — the metric must stay above/below the threshold for 5 consecutive minutes
The evaluator uses a rolling average over the duration window to smooth out momentary fluctuations.
Scoping
Every custom configuration has a scope that determines which nodes it applies to.
| Scope | Applies To |
|---|---|
| Global | All nodes in the system |
| Site | All nodes in a specific site |
| Node Group | All nodes in a specific node group |
| Node | A single node |
Custom configurations are additive, not overriding. When a built-in and a custom configuration both match the same metric on a node — or when two custom configurations at different scopes both match — Stratora evaluates each one independently. Each can fire its own alert, with its own thresholds and its own escalation team.
This is intentional: it lets you fan out a single condition (e.g., high CPU) to different teams at different scopes. For example, point the global built-in at a general operations team, and add a node-level custom configuration on a database server that points at the database on-call team with a stricter threshold. Both teams hear about CPU on that node; only the operations team hears about CPU elsewhere.
If you want to silence a built-in on a specific node or group, disable the built-in (which disables it everywhere) or use maintenance windows to suppress alerts on that scope.
Template-Generated Configurations
Device templates can include their own alert rules. For example, the VMware vCenter template ships with rules for:
- vCenter unreachable (100% packet loss for 3 minutes)
- ESXi host high CPU (> 90% for 10 minutes)
- ESXi host critical CPU (> 95% for 5 minutes)
- ESXi host high memory (> 90% for 10 minutes)
- VM high CPU / memory / disk latency
- Datastore usage warnings
These template rules are applied automatically when a node uses the template — no manual configuration needed.
Evaluation
The alert evaluator runs on a 10-second cycle, checking every enabled configuration against current metric data.
For metric-type configurations, the evaluator:
- Queries the metric from VictoriaMetrics using a PromQL-compatible query
- Applies duration averaging if configured (e.g.,
avg_over_timeover 5 minutes) - For multi-instance metrics (disk volumes, network interfaces), evaluates the worst-value instance
- Compares the result against warning and critical thresholds
- Creates, updates, or resolves alerts based on the result
For service and interface configurations, the evaluator checks the current state directly.
For reachability configurations, the evaluator fires on the first evaluation cycle showing 100% packet loss — typically 20–30 seconds from the moment a node becomes unreachable. The 3-cycle streak applies only when no ping data is being collected at all (for example, a Telegraf misconfiguration where the node never reports a ping sample), not to actual packet-loss readings. See Alerts — Node Unreachable detection for the full timing breakdown.
A 20-second resolution grace period applies to most configurations. Once a condition clears, the evaluator waits 20 seconds of sustained normal readings before resolving the alert — this prevents flapping between active and resolved states.
Reachability alerts (Node Unreachable, Agent Heartbeat Lost, Collector Offline) skip the grace period because they already require a multi-cycle recovery streak before they consider the node back; an additional grace period would only delay recovery without adding stability. See Alert Response Times for the per-alert-type detection and recovery latency reference.
Escalation Team Assignment
Each configuration can optionally be linked to an escalation team. When an alert fires from that configuration, the escalation team's notification steps are triggered automatically.
If no escalation team is assigned, the alert is still created and visible in the UI — it just won't generate notifications.
Sending a test alert
Stratora can fire a test alert against any saved alert configuration so you can confirm the alert appears in the alerts list and the configured email recipients receive a notification.
To send a test alert:
- Open Alert configurations from the sidebar.
- Select the alert configuration you want to test.
- Click Fire test alert.
- Choose a severity (Warning, Critical, or Resolved) and confirm.
When you fire a test alert:
- A test alert appears in the alerts list with a TEST badge.
- An email is sent to the recipients resolved through the configuration's assigned escalation team — the same recipient resolution real alerts use. Subjects are prefixed
[TEST]and the body shows an orange TEST ALERT banner so recipients can tell at a glance the alert was fired manually. - The test alert auto-resolves five minutes after firing.
- The test alert is excluded from device counts, the licensed device total, dashboard health summaries, and reports.
If the configuration has no escalation team assigned, the test alert still appears in the alerts list, but no email is sent — by design. The configuration's first-step email channels are the source of truth for test recipients; with no team, there are no recipients to dispatch to. Assign an escalation team and re-fire if you wanted to validate notification routing.
Fire test alert is a dispatch validation tool, not an audit-tracked event. Test alert sends do not populate the notification audit log. To verify real-alert delivery history for compliance evidence, look at history generated from real alerts.
To test SMS, Voice, Slack, Teams, or webhook delivery, use the Test button on each individual channel inside the escalation team configuration. Those tests route through the same delivery code Stratora uses for real alerts, so a successful per-channel test is a strong signal the channel is wired correctly.
Firing test alerts requires the alert:test permission, which is granted to administrators only.
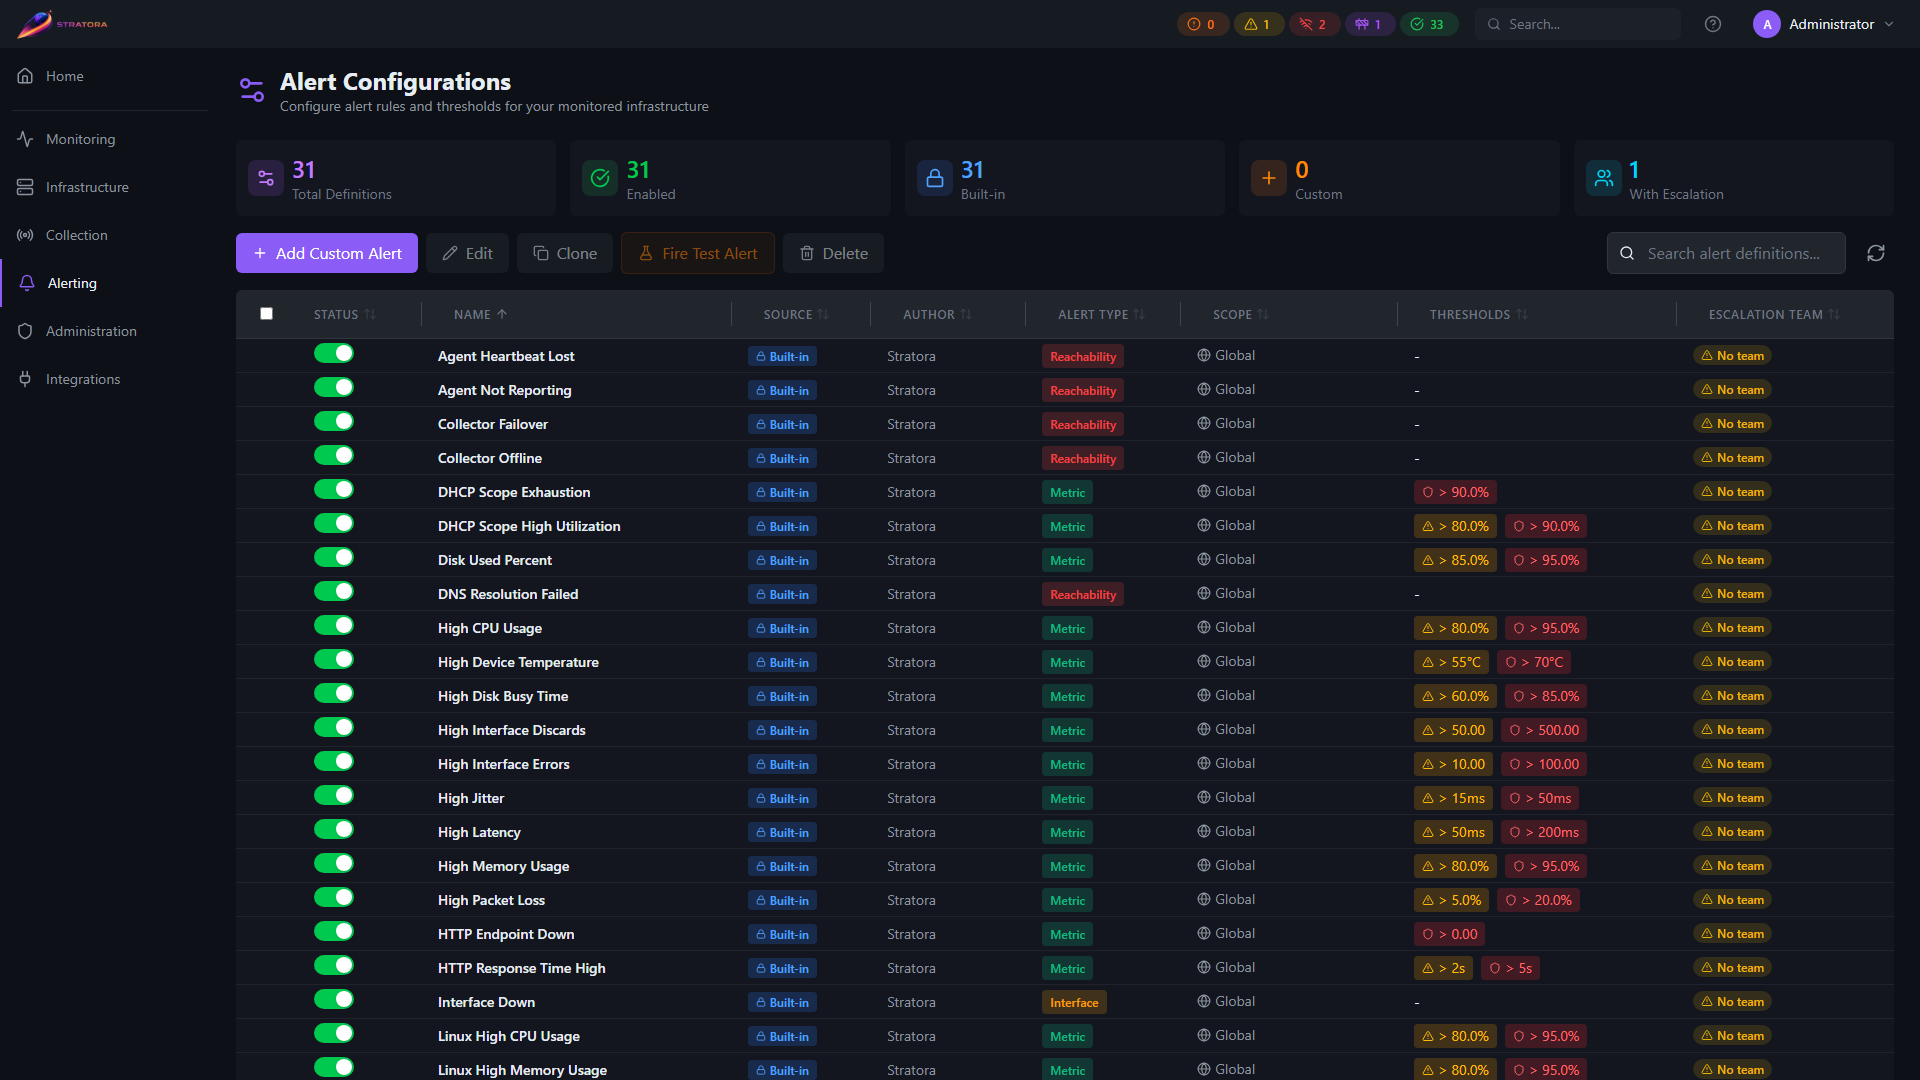
Unified View
The Alert Configurations page shows both built-in and custom configurations in a single list. Each entry displays:
- Source — whether the configuration is built-in (by Stratora) or custom (by a user)
- Author — "Stratora" for built-in, or the username who created it for custom
- Scope — global, site, group, or node
- Thresholds — warning and critical values
- Status — enabled or disabled
- Escalation team — the linked team, if any