Home Dashboard
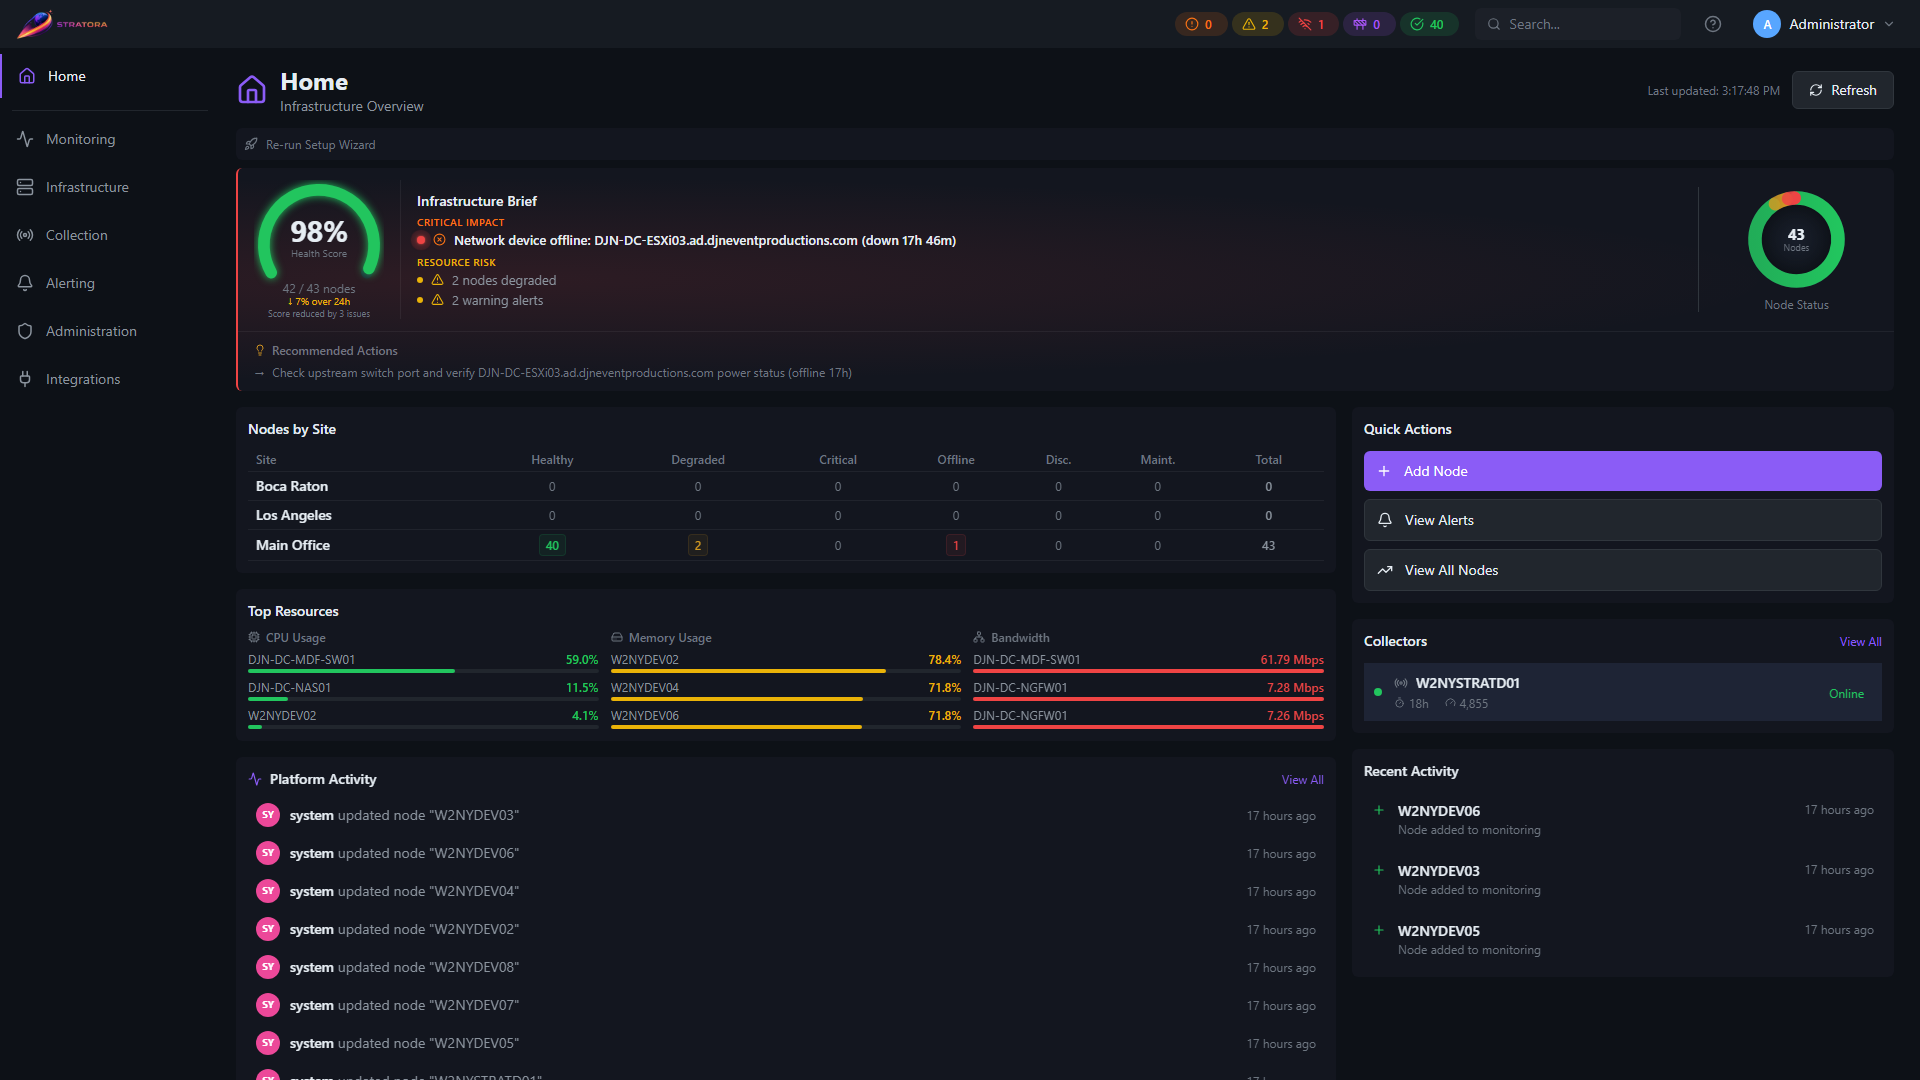
The Home page is Stratora's daily-driver overview — the first surface you see after login and the screen most operators leave open during their shift. It triages what needs attention across every site, gives you the platform's overall health at a glance, and routes you into deeper views when something needs investigating.
What's on the page
Status counters (top bar)
The status counters in the top bar — visible on every page in Stratora, not just Home — show how many monitored nodes are currently Critical, Degraded, Offline, Maintenance, and Healthy. The counters update on the same cadence as the rest of the page (~10 seconds). Click any counter to open the Nodes list filtered to that status — useful when you want to immediately see which devices are flagged.
Infrastructure Brief (hero card)
The hero card on the Home page is the Infrastructure Brief — a one-screen triage that combines:
- The Health Score gauge — the platform's overall health percentage. See Health score methodology below for how it's calculated.
- Three status donuts — proportional counts of Critical, Degraded, and Healthy nodes across the deployment.
- Triage bullets — short text callouts highlighting the most consequential issues right now (sites with the most critical nodes, the noisiest alerting categories, recent state changes).
If everything is healthy the brief reads "ALL CLEAR" and the gauge shows 100%. When that's not the case, the bullets tell you what to look at first.

Recommended Actions
When Stratora detects actionable items — pending agents waiting for approval, unbound IPAM subnets, a credential about to expire, a discovery job that finished and has importable devices — they surface in the Recommended Actions card. The card only appears when there are actions to recommend. Each item links straight to the relevant page in Stratora.

Nodes by Site
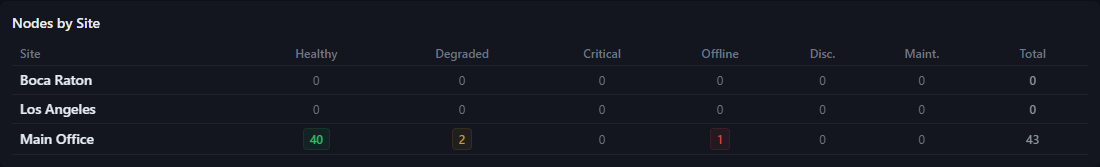
The Nodes by Site table breaks down node counts per site, columned by status (Healthy, Degraded, Critical, Offline, Discovering, Maintenance, Total). Click any site name to open its per-site dashboard with the same context preserved. Empty sites show zeros across the row — useful when you've defined a site but haven't imported any nodes yet.
Top Resources
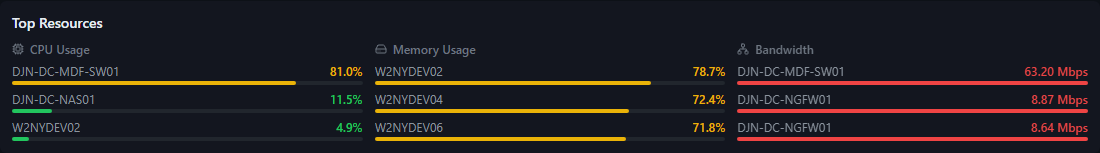
The Top Resources card shows the three most utilized resources across the deployment: top CPU Usage, top Memory Usage, and top Bandwidth. Each column lists the top three nodes for that metric. Click any node to open its detail page.
Platform Activity
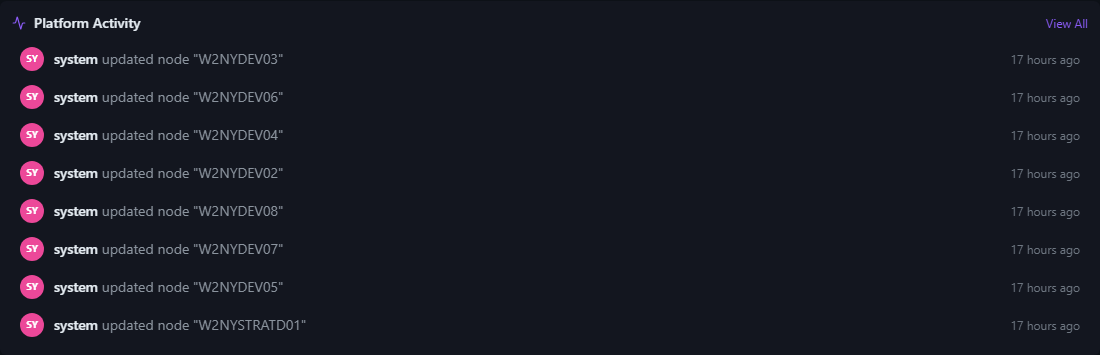
The Platform Activity card surfaces recent significant events from the audit log — node approvals, credential changes, alert acknowledgments, user actions. This is your at-a-glance record of "what's been happening on Stratora" without having to navigate to the full Audit Logs page. The full log lives at Audit Logs.
Quick Actions
The Quick Actions card gives you single-click shortcuts to the most common workflows: Add Node, View Alerts, View All Nodes. Operators with limited daily Stratora use will reach for these.
Collectors
The Collectors card lists every registered Collector with its name, status (Online / Offline / Stale), last heartbeat age, and current target count. Click any collector to open its detail view. Use this card to verify your collection fleet is healthy before relying on the metrics it produces.

Recent Activity
The Recent Activity card mirrors Platform Activity but scopes to per-node events — recently-added nodes, recent status transitions, recent metric anomalies. Empty when there's been no recent change.
Health score methodology
The percentage shown in the Health Score gauge is a weighted aggregation across all monitored nodes:
- Each node contributes a score based on its current health status: Healthy = 100%, Degraded = a partial credit, Critical / Offline = 0%, Discovering = neutral (excluded from the average), Maintenance = neutral.
- Sites are weighted by their node count — a 50-node site contributes more weight than a 5-node site.
- The result is a single percentage that tracks the deployment's overall health day over day.
The score is intended as a directional indicator, not a precise SLA metric. Use it to spot trend changes; use the per-node and per-site dashboards for incident-level detail.
Common workflows from the Home page
Start your shift here. A glance at the Infrastructure Brief tells you whether anything broke overnight. Recommended Actions tells you whether anything needs your attention before your first standup. Nodes by Site tells you which sites carry the current weight.
Triage during an incident. When the Critical counter ticks up, click it to jump to the affected nodes. The Top Resources card often surfaces resource-saturation incidents faster than the alert engine does — a CPU spike will show up in Top Resources before the threshold-based alert fires.
Wind down your shift. Platform Activity gives you a quick read of what changed today — who approved which agents, who acknowledged which alerts, which credentials were touched. Useful for handoffs and post-incident reconstruction.
Refresh cadence
The Home page refreshes automatically every ~10 seconds. The Refresh button at the top forces an immediate refresh — useful when you want to see the effect of an action you just took (for example, after approving a pending agent).