Maps
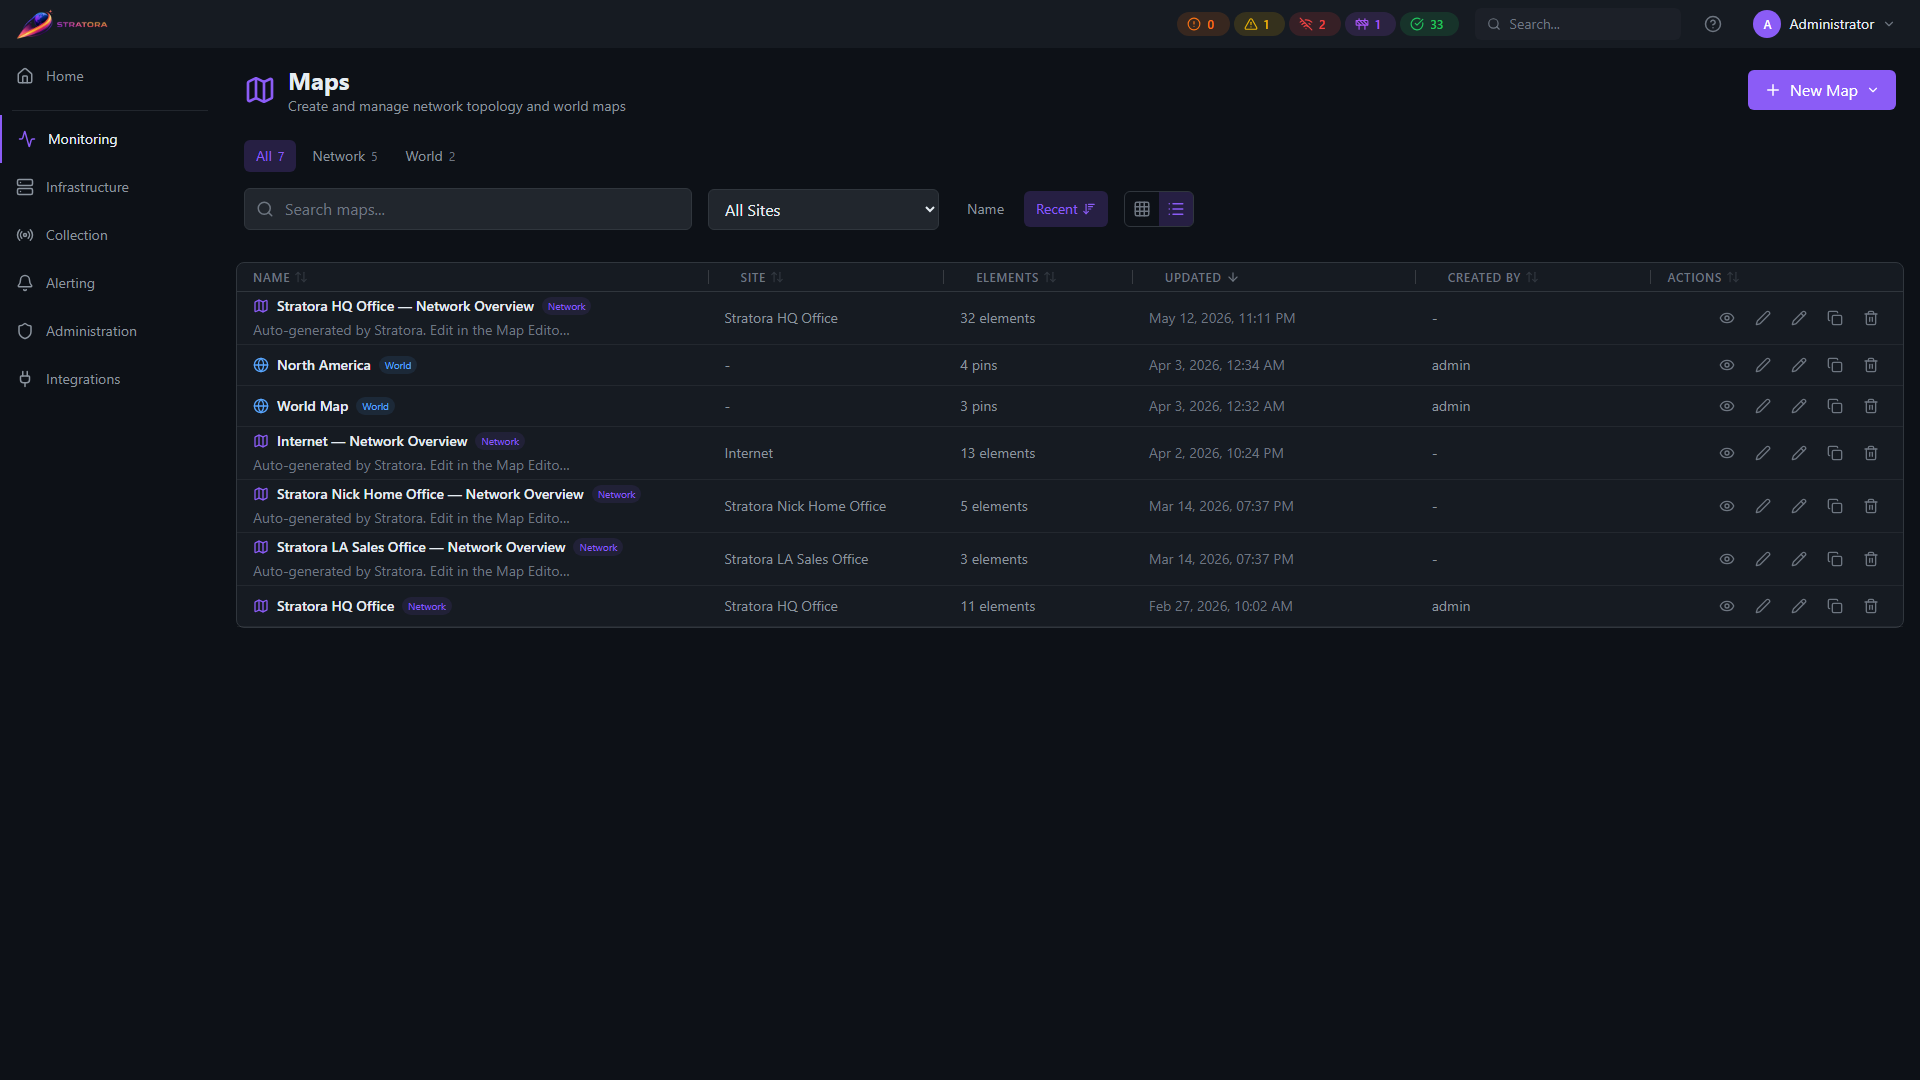
Stratora provides two types of interactive maps for visualizing your infrastructure:
- Topology maps — logical network diagrams showing how devices connect, with live status overlays
- World maps — geographic views showing site locations with health status pins
Both map types use the same three-panel builder pattern as dashboards: a left sidebar for browsing available items, a center canvas for placement, and a right panel for properties and configuration. Both support edit/view mode separation and can be embedded as panels inside dashboards.
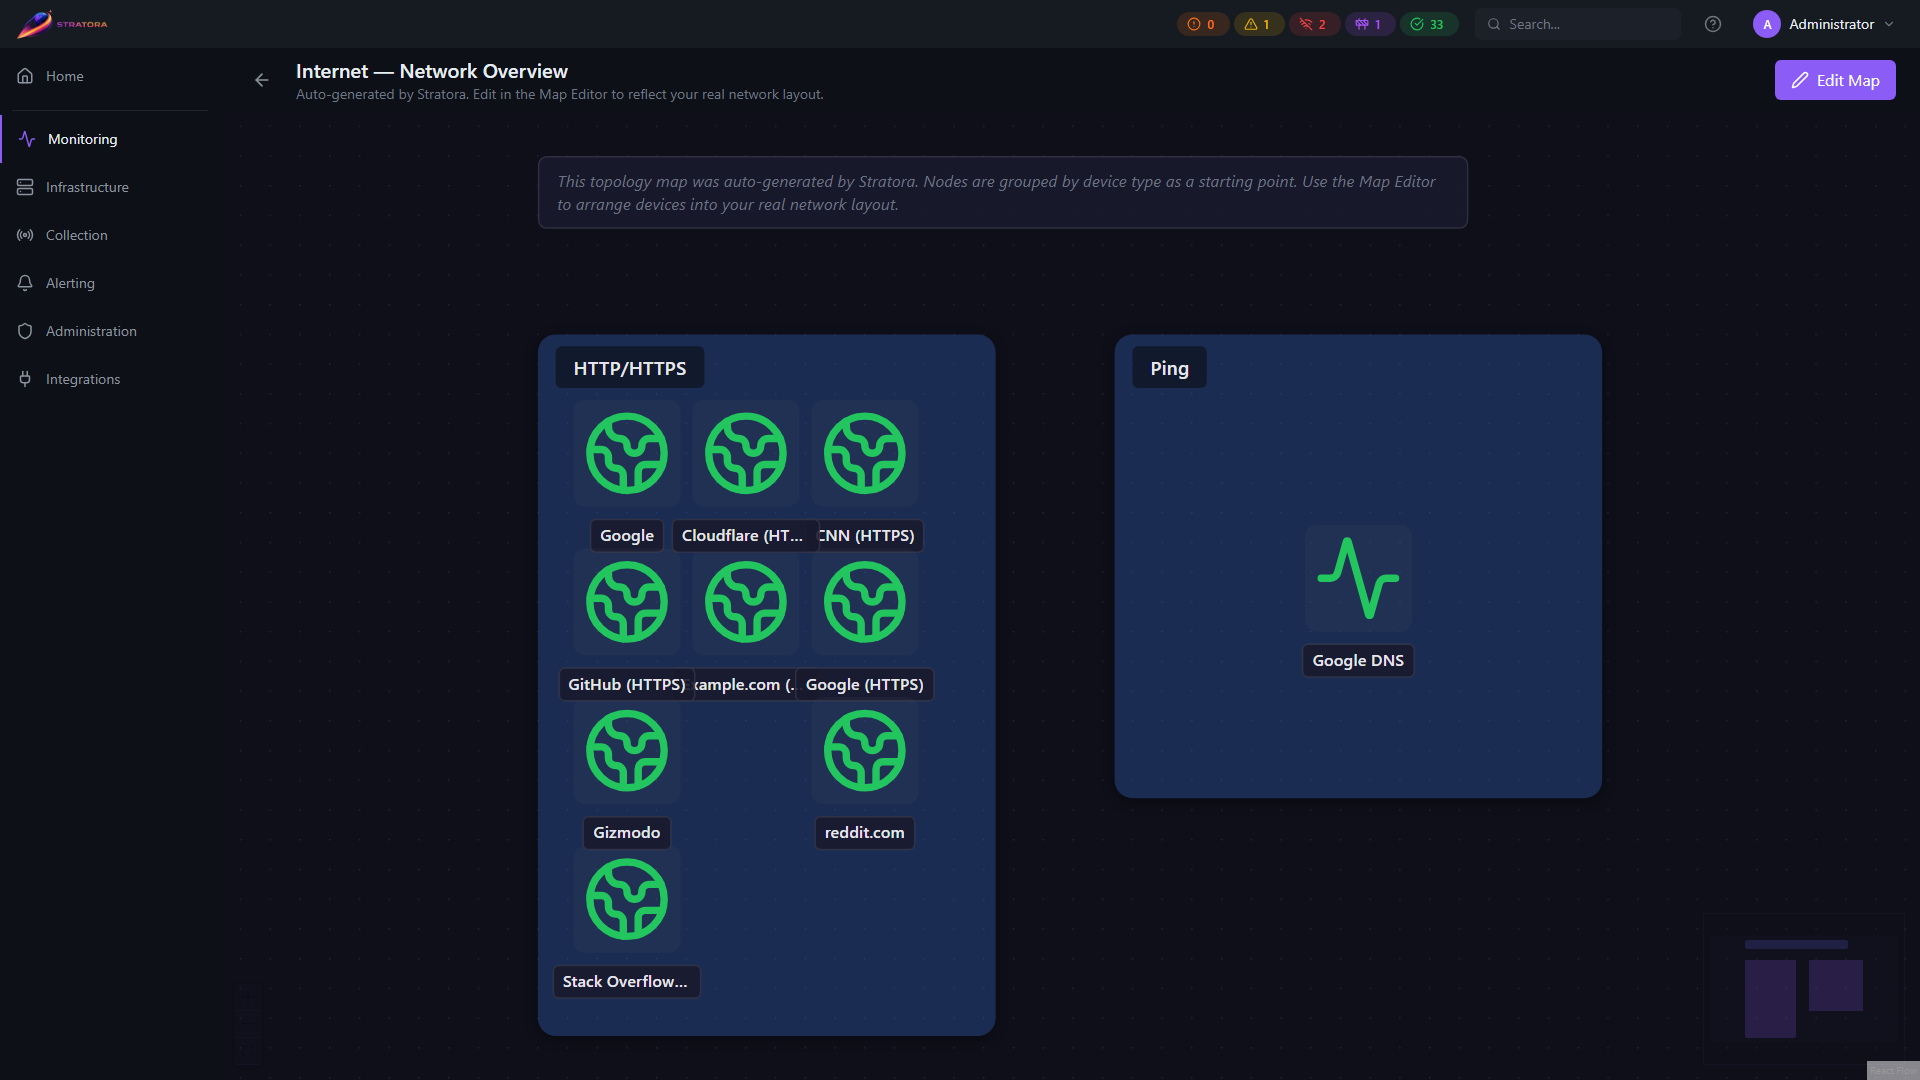
Topology Maps
A topology map is a visual diagram of your infrastructure — devices, connections, and logical groupings laid out on a canvas with real-time health overlays.
What's on the Canvas
| Element | Description |
|---|---|
| Device nodes | Represent monitored nodes — switches, servers, firewalls, etc. Show real-time health via color-coded borders (green / yellow / orange / red / purple, see below) |
| Labels | Text annotations for documenting your diagram |
| Zones | Rectangular grouping areas that visually organize related devices (e.g., "Server Room", "DMZ", "Core Network") |
| Connections | Lines between devices representing physical or logical links, with optional interface assignment and utilization display |
Building a Topology Map
- Navigate to Monitoring → Maps and click New Topology Map
- The builder opens with three panels:
- Left sidebar — browse available devices to place on the canvas
- Center canvas — the interactive diagram area with pan and zoom
- Right panel — properties for the selected element (styling, interfaces, position)
- Drag devices from the sidebar onto the canvas
- Draw connections by dragging between device handles
- Add zones and labels as needed
- Click Save to persist the layout
Device Nodes
Each device node on the map is linked to a monitored node. The node's border color reflects its real-time health status:
- Green — healthy
- Yellow — warning
- Orange — critical
- Red — offline
- Purple — maintenance
Hover over a device to see its name, IP address, status, uptime, response time, and last-seen timestamp. Click to navigate to the node's detail page.
Zones
Zones are rectangular areas that group related devices. They render behind device nodes and serve both as visual organization and as aggregation boundaries.
- Customizable appearance — border style (solid, dashed, dotted), border color, fill color with opacity
- Label positioning — top-left, center, or top-right
- Health tooltip — hover over a zone to see a summary of device health within it (e.g., "5 devices: 4 healthy, 1 warning")
Use zones to represent functional areas of your network — server rooms, VLANs, security zones, or cloud regions. When a device inside a zone goes critical, the zone's tooltip immediately reflects the degraded state.
Connections
Connections represent links between devices. They support:
- Interface assignment — associate each end of a connection with a specific network interface (auto-discovered from metrics)
- Line styles — solid, dashed, or dotted
- Edge types — straight, bezier curve, smooth step, or step
- Bend points — add manual bend points for cleaner routing (Alt+Click to add, double-click to remove)
- Utilization display — optionally show live throughput on the connection
- Status coloring — connections change color when an interface has errors or is down
Edit vs. View Mode
- Edit mode (builder) — full drag-and-drop, element creation, connection drawing, property editing, save controls
- View mode — read-only diagram with pan/zoom, hover tooltips, and click-to-navigate
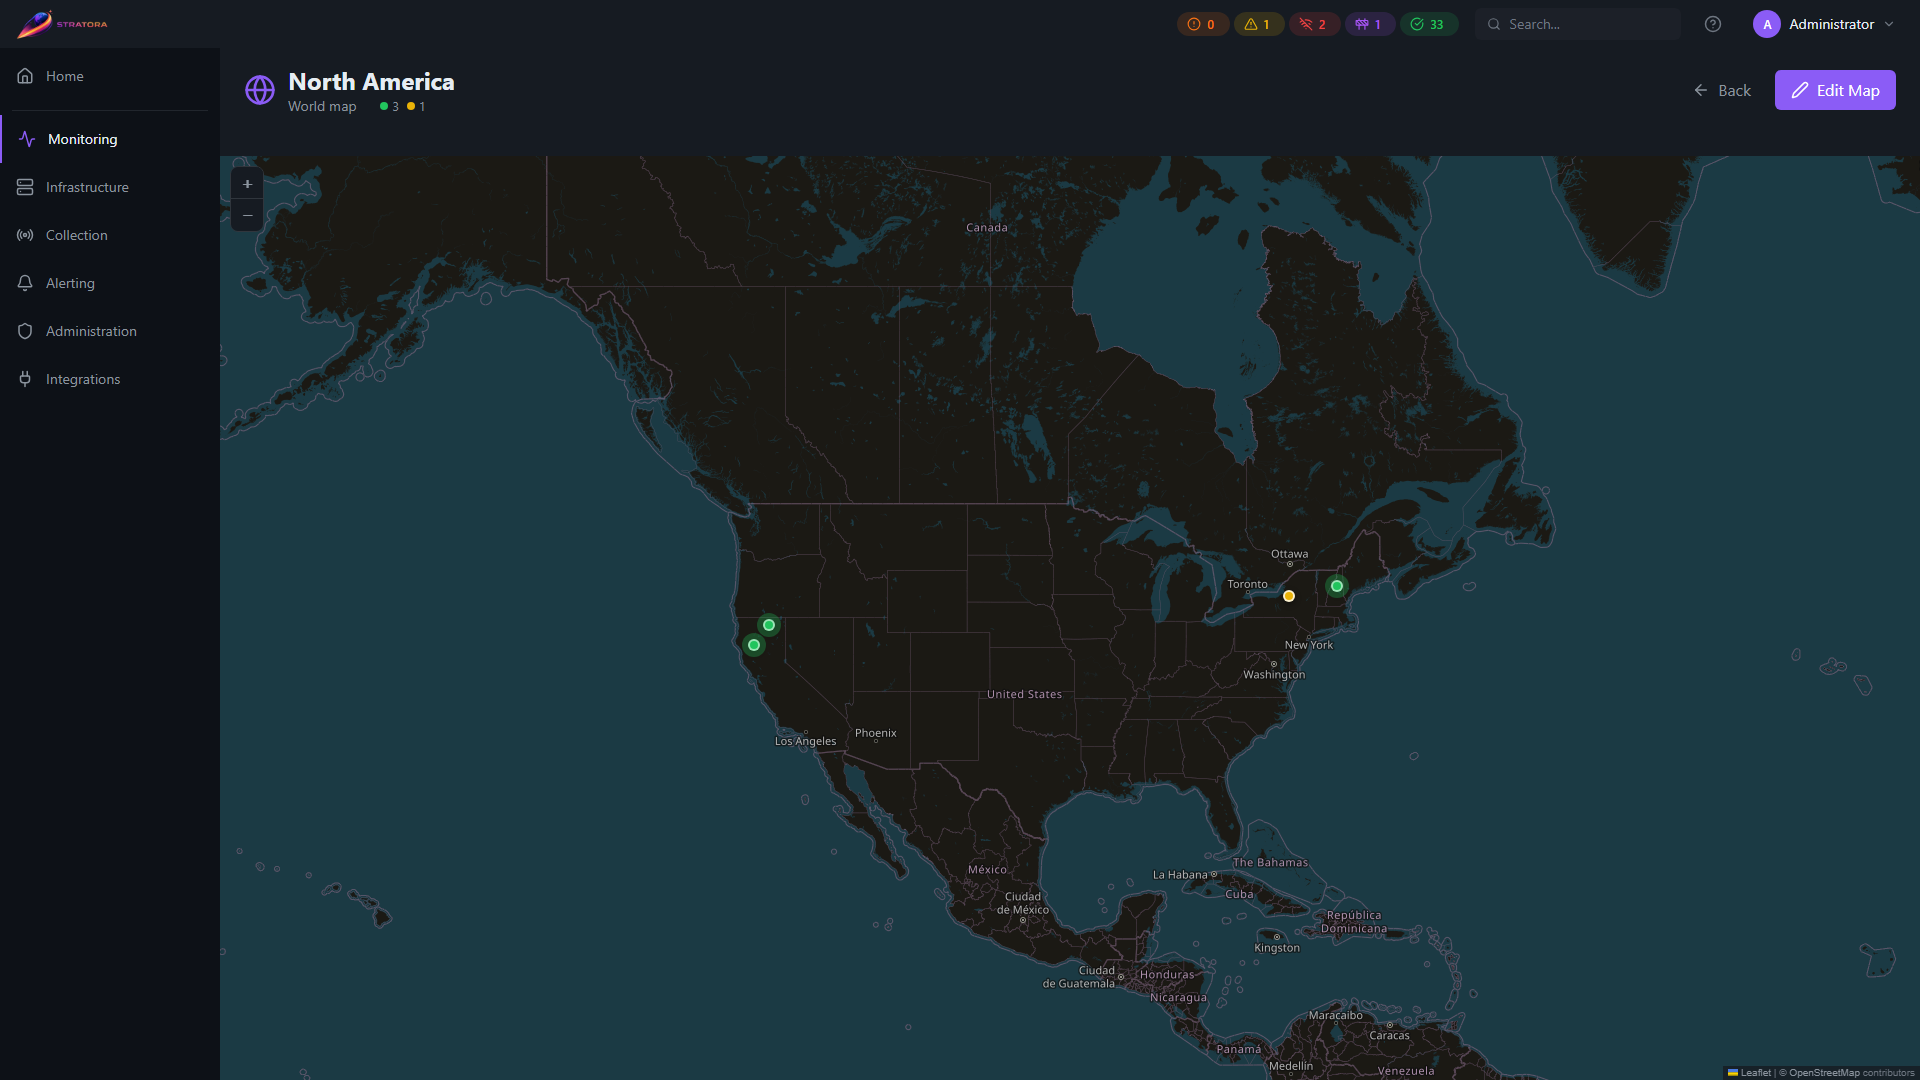
World Maps
A world map shows your sites, maps, and dashboards as pins on a geographic view, with live health status. World maps use dark-themed OpenStreetMap tiles — no external account or API key required.
Pin Link Types
You can place four kinds of pins on a world map:
| Link Type | Navigates To | Health Color Source |
|---|---|---|
| Site | Site detail page | Aggregated reachability of all nodes at the site |
| Network Map | Network map view | Health of devices placed on that map |
| World Map | Another world map | Worst-state rollup from the linked map (hierarchical) |
| Dashboard | Site dashboard | Reachability of the dashboard's associated site |
The Dashboard link type only shows auto-generated site dashboards — dashboards that are associated with a specific site. Custom dashboards without a site association are not available as pin destinations.
Health Status
Pin colors reflect real-time health based on node reachability:
| Color | Meaning |
|---|---|
| Green | All nodes online |
| Yellow | Some nodes degraded |
| Orange | Critical alerts |
| Red | Nodes offline |
| Purple | In maintenance |
| Gray | Unknown or no nodes |
Building a World Map
- Navigate to Monitoring → Maps and click New World Map
- The builder opens with three panels:
- Left sidebar — browse sites, network maps, and other world maps available for pinning
- Center canvas — interactive geographic map with pan and zoom
- Right panel — pin properties editor (appears when a pin is selected)
- Drag items from the sidebar onto the map, or click Place Pin to add a pin by clicking the map
- Select a pin to configure its properties in the right panel
- Click Save to persist, or View to switch to view mode
Pin Placement — Three Methods
When positioning a pin on the map, three input methods are available simultaneously. All three stay in sync — changing one updates the others.
| Method | How It Works |
|---|---|
| Address search | Type any address, city, or place name into the search field. An autocomplete dropdown shows up to 5 results (powered by OpenStreetMap Nominatim — all countries supported). Select a result to set the pin coordinates. |
| Lat/Lng entry | Type latitude (-90 to 90) and longitude (-180 to 180) directly into the coordinate fields. The pin repositions as you type. |
| Drag on map | Drag an existing pin to a new position. The coordinate fields update in real-time. |
Pin Properties
When a pin is selected, the right panel shows:
- Label — custom display name. Shown as bold text in the pin tooltip. Defaults to the linked entity's name.
- Address Search — geocoding field to find and set coordinates by place name
- Latitude / Longitude — direct coordinate entry
- Link Type — Site, Network Map, World Map, or Dashboard
- Link Target — dropdown to select the specific entity to link to
- Health Source — for Site pins: choose which site drives the pin color. For Dashboard pins: automatically set to the linked dashboard's site (shown as a read-only label).
Pin Tooltip
Hovering over a pin shows:
- Custom label (bold) — the pin's display name
- Entity name (muted subtitle) — only shown when the label differs from the linked entity name
- Node counts — online/offline breakdown when health data is available
- Link type indicator — for network map and world map pins
Preset Views
The world map includes preset zoom levels for quick navigation:
- World, North America, Europe, Asia Pacific, South America, Africa, Middle East
- US regional views (Northeast, Midwest, West)
- UK & Ireland, DACH (Germany/Austria/Switzerland)
Drill-Down
Click a pin to navigate to the linked resource — site detail page, network map, nested world map, or site dashboard. This makes world maps a natural entry point for a hierarchical view of your infrastructure — start with a global view, click into a region, then into a specific site or dashboard.
Embedding Maps in Dashboards
Both map types can be embedded as panels in dashboards:
- Topology Map panel — displays a saved topology map with live status, pan/zoom, and hover tooltips
- World Map panel — displays a saved world map with live pin health and drill-down. Each panel instance remembers its own zoom level and center position independently.
Maps as Live Documentation
Beyond real-time monitoring, maps serve as living documentation of your environment:
- Topology maps document logical network architecture — device placement, connectivity, and functional zones
- World maps document site locations and the relationships between them
- Both update automatically as device health changes, keeping your documentation current without manual effort