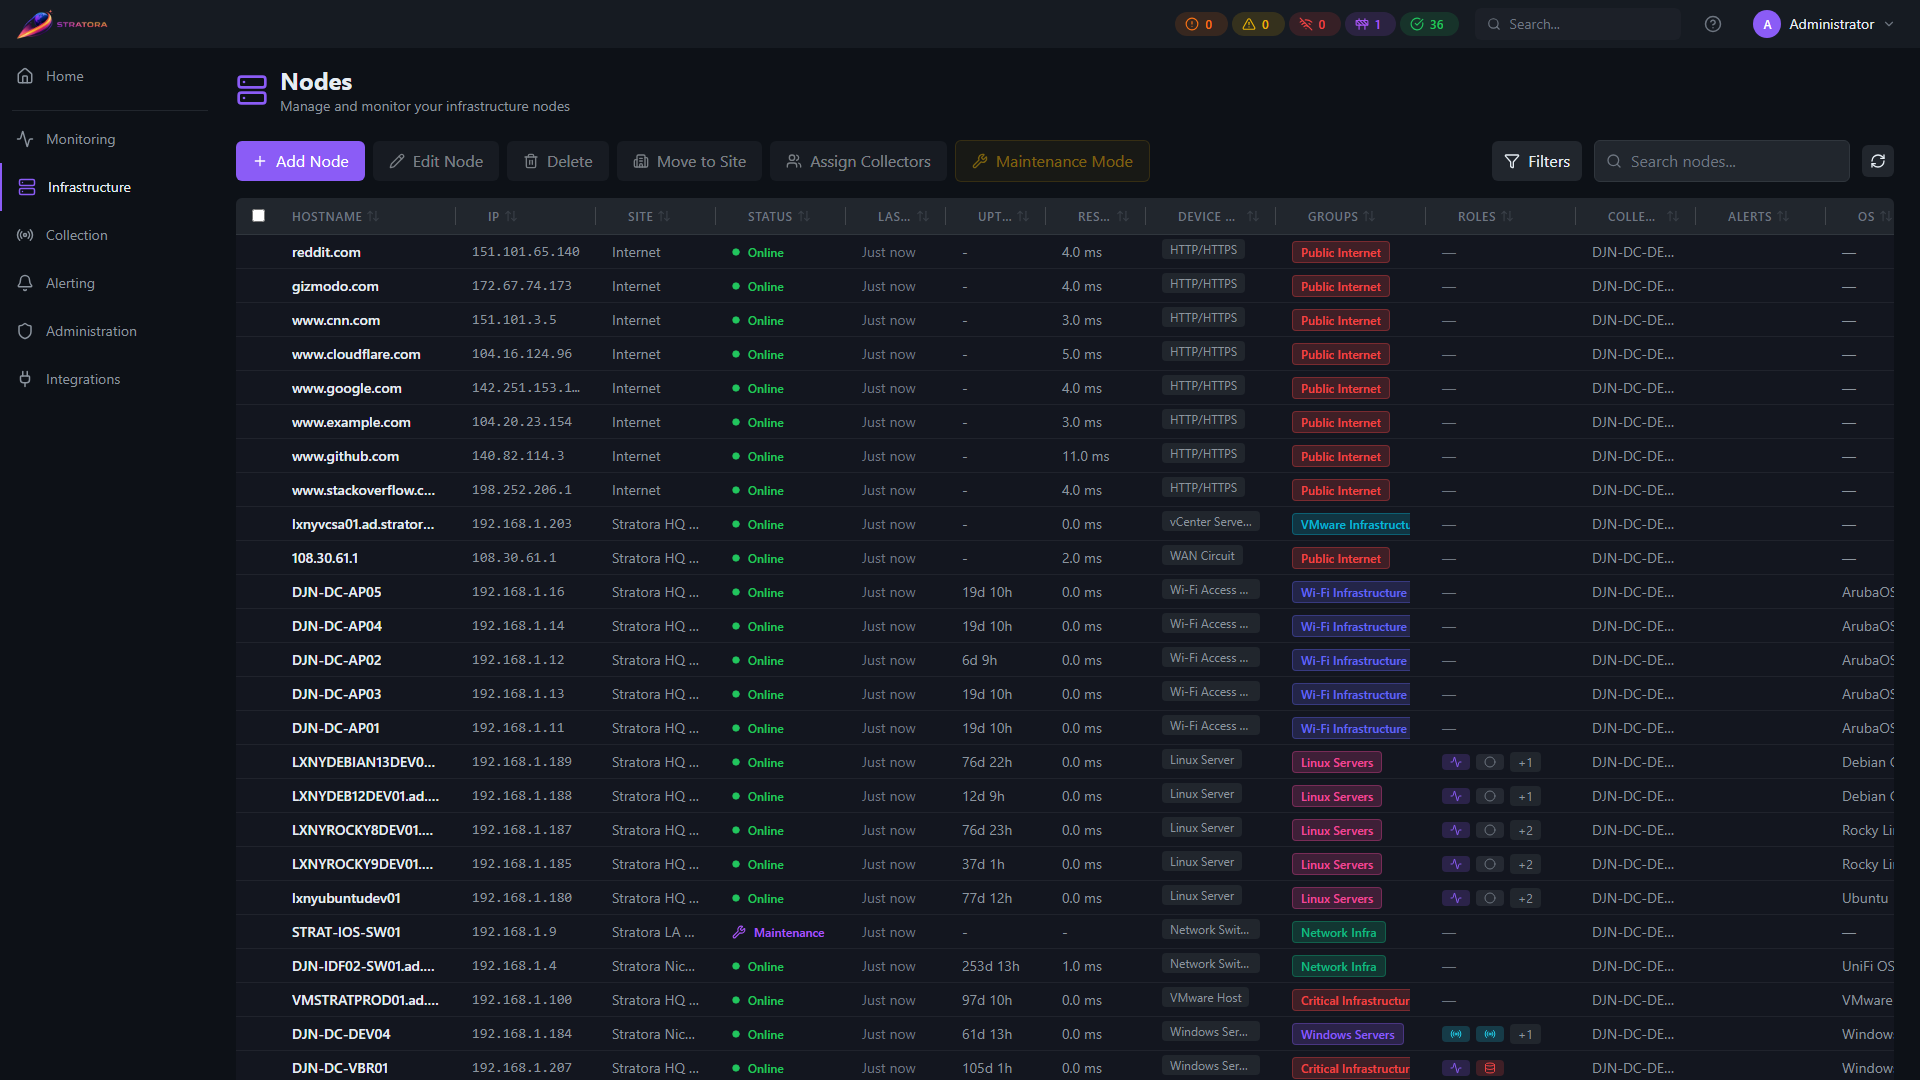
Nodes
A node is any device Stratora monitors — a Windows server, Linux box, network switch, firewall, NAS, VMware host, or anything reachable by SNMP, an agent, or a ping. Nodes are the core unit of monitoring: every metric, alert, and dashboard panel ties back to a node.
Every node belongs to a site and is assigned a device template that determines what gets collected. Nodes can also be organized into node groups for filtering and management.
Node Types
| Type | Protocol | Examples |
|---|---|---|
| Windows Server | Agent (Telegraf) | Domain controllers, SQL servers, IIS, Hyper-V hosts |
| Linux Server | Agent (Telegraf) | Web servers, database servers, Docker hosts |
| Network Switch | SNMP | Cisco Catalyst, Cisco SG300/CBS, Ubiquiti UniFi |
| Firewall | SNMP | Palo Alto PA series |
| Storage (NAS/SAN) | SNMP | Synology, QNAP |
| VMware ESXi Host | SNMP | ESXi 6.x/7.x/8.x hosts |
| VMware vCenter | vSphere API | vCenter Server Appliance |
| Wi-Fi Controller / AP | SNMP | Aruba Instant APs |
| HTTP/HTTPS Endpoint | HTTP | Web apps, APIs, public URLs |
| Ping | ICMP | Any IP-reachable device |
Adding Nodes
There are three ways to add nodes to Stratora.
Manual Creation
Navigate to Infrastructure → Nodes and click Add Node. You'll need:
- Name — display name for the node
- IP Address — must be reachable from the assigned collector
- Node Type — select from the dropdown (Windows Server, Network Switch, etc.)
- Site — every node must be assigned to a site (required)
- Device Template — determines what metrics are collected
- Credentials — SNMP community, API keys, or other authentication as required by the template
The node enters Discovering status until the first metrics arrive.
Via Discovery Import
Run a network discovery scan against a subnet. Stratora probes each host with ICMP, SNMP, HTTP banners, and other signals to identify device types and auto-match templates. You then review the results and import selected devices as nodes.
During import, Stratora automatically:
- Sets the node type based on fingerprinting results
- Assigns the best-matching device template
- Populates SNMP system fields (sysDescr, sysObjectID, sysName)
- Assigns the node to the site where the discovery was run
- Creates an IPAM address record for the discovered IP
Via Agent Enrollment
When you install the Stratora Agent on a Windows or Linux server, the agent registers itself with the Stratora server during first startup. The node appears in Infrastructure → Nodes with a Pending approval status. Once you approve the node, monitoring begins.
See Enrollment for installation and registration details.
Agent-enrolled nodes automatically detect installed roles and services. For example, a Windows server running Active Directory will have LDAP, DNS, and DHCP metrics collected without extra configuration.
Node Detail View
Click any node to open its detail view. The layout adapts based on the device template.
What You See
- Header — node name, IP address, type, current health status, and uptime
- Dashboard panels — template-driven gauges, charts, and tables for the node's key metrics (CPU, memory, disk, interface traffic, etc.)
- System info — OS, manufacturer, model, serial number (populated by agent or SNMP)
- Assigned collector — which collector is polling this node
- Active alerts — any currently firing alerts with severity and duration
- Node groups — color-coded group badges showing which groups this node belongs to
Key Metrics by Type
| Node Type | Primary Metrics |
|---|---|
| Windows/Linux Server | CPU (per-core), memory, disk usage/IO, network throughput, services, uptime |
| Network Switch | Port status grid, CPU, per-interface traffic (TX/RX), interface errors |
| Firewall | Management/data-plane CPU, active sessions, throughput, connections/sec, HA state |
| NAS/Storage | Disk health, RAID status, volume capacity, temperature, read/write IO |
| VMware ESXi | CPU/memory, VM count, datastore usage, per-vmnic throughput |
| VMware vCenter | Cluster resources, top VMs by CPU/memory, datastore usage, VM latency |
| Wi-Fi Controller / AP | Connected clients by SSID, radio utilization, AP memory/CPU |
| HTTP/HTTPS | Response time, HTTP status code, availability percentage, SSL certificate expiry |
| Ping | Response time (min/avg/max), packet loss |
Health Status
Every node has a health status that reflects its current state. Status is evaluated automatically by the alert engine on a 10-second cycle.
| Status | Meaning |
|---|---|
| Discovering | Node was just added — waiting for the first metrics to arrive |
| Healthy | Node is reachable and all metrics are within normal thresholds |
| Warning | Node is reachable but one or more metrics have crossed a warning threshold |
| Critical | Node is reachable but one or more metrics have crossed a critical threshold |
| Offline | No data received for 5+ minutes (unreachable) |
| Maintenance | Node is in a scheduled or manual maintenance window (alerts suppressed) |
Health status is driven by alert configurations. The highest-severity active alert determines the node's status. If no alerts are firing and the node is reachable, it shows as Healthy.
Bulk Actions
Select multiple nodes from the node list to perform bulk operations.
Assign to Site
Move selected nodes to a different site. Useful when reorganizing after initial setup or when a new site is created.
- Select nodes → Actions → Move to Site → choose target site
- Up to 500 nodes per operation
- Nodes already in the target site are skipped automatically
Assign Collector
Change which collector polls the selected nodes. When you reassign a collector, the old collector's configuration is regenerated to remove the nodes, and the new collector picks them up on its next config pull (within ~10 seconds).
Maintenance Mode
Place selected nodes into maintenance mode to suppress alerts during planned work. See Maintenance for details.
Approval Workflow
Nodes registered via agent enrollment arrive with Pending approval status. This prevents unknown devices from being monitored automatically.
From the node list or detail view:
- Approve — activates monitoring, the collector begins polling
- Reject — marks the node as rejected, no monitoring occurs
Rejected nodes remain in the database but are excluded from monitoring and dashboards. You can approve a rejected node later if needed.
Node Fields Reference
| Field | Description | Source |
|---|---|---|
| Name | Display name | Manual or agent hostname |
| IP Address | IPv4 address | Manual or discovery |
| Hostname | Device hostname | Agent or DNS |
| Node Type | Device category | Manual, discovery, or agent |
| Site | Parent site | Manual (required) |
| Template | Device template | Manual or discovery auto-match |
| Environment | production, staging, or development | Manual (default: production) |
| Node Groups | Color-coded group memberships | Manual |
| OS Name / Version | Operating system | Agent or SNMP sysDescr |
| Manufacturer / Model | Hardware info | Agent (WMI/DMI) or SNMP |
| Serial Number | Device serial | Agent or SNMP |
| SNMP sysObjectID | Vendor enterprise OID | SNMP probe |
| Last Seen | Timestamp of most recent data | Automatic |