Rack Diagrams
Rack diagrams give you a visual representation of your physical equipment racks with live health overlays. Place monitored devices into rack positions to create an accurate picture of what's installed where — and see at a glance when something goes wrong.
Concepts
Locations
Racks are organized into a hierarchical location structure within each site:
Site → Building → Floor → Room → Closet → Rack
Each level is optional — you can nest as deep or shallow as your environment requires. A small deployment might just have Site → Rack, while a large data center might use the full hierarchy.
Racks
A rack represents a physical equipment cabinet. Key properties:
| Field | Description |
|---|---|
| Name | Display name (e.g., "Rack A1", "MDF-R01") |
| U Height | Total rack units — typically 42U or 48U |
| Site | Which site this rack belongs to |
| Location | Position in the location hierarchy |
Assets
An asset is a monitored node placed into a rack position. Each asset has:
- U start — the starting rack unit (U1 is at the bottom)
- U size — how many rack units the device occupies (1U, 2U, 3U, etc.)
- Face — front or rear of the rack
- Label — optional custom label (defaults to the node name)
Building a Rack Layout
The rack builder uses the same three-panel layout as dashboards and maps:
- Left sidebar — browse available devices that can be placed into the rack
- Center visualization — the rack itself, showing all placed devices with U numbering
- Right panel — asset list and configuration for the selected device
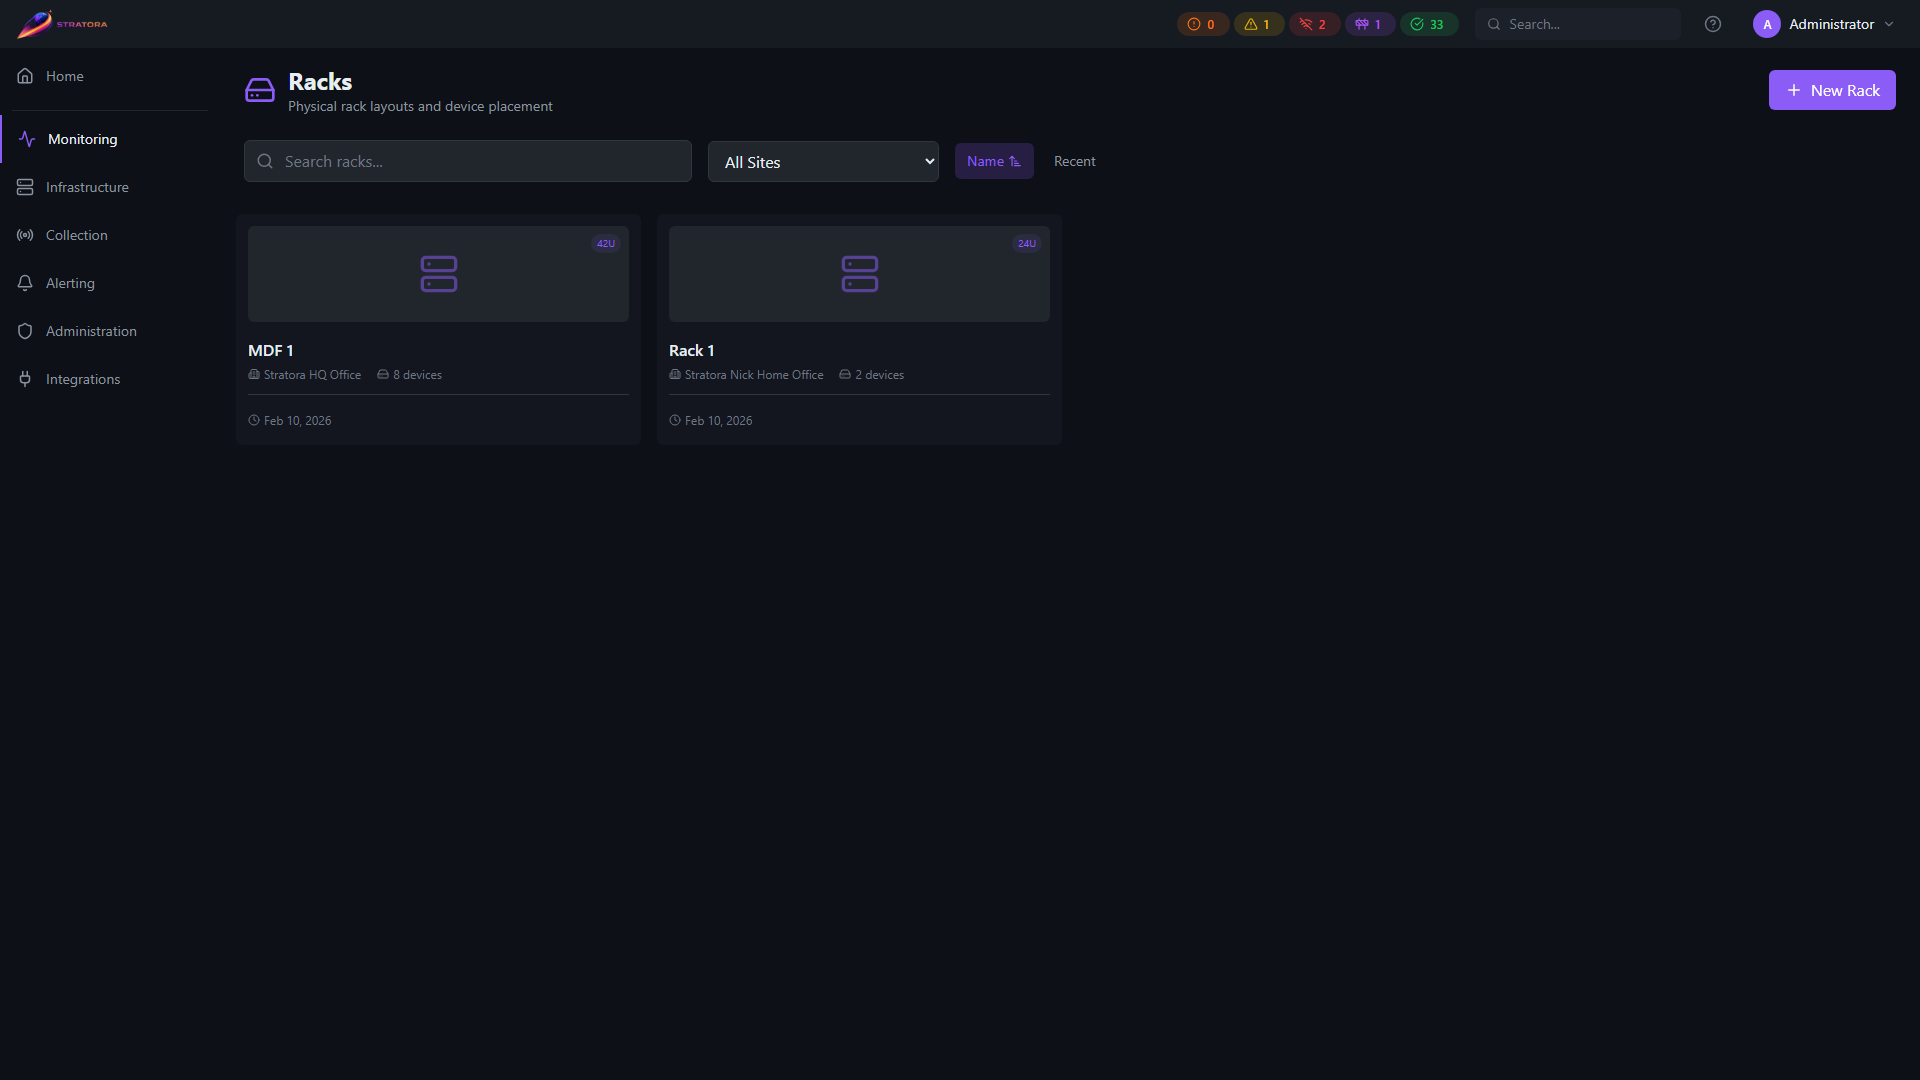
Placing Devices
- Navigate to Monitoring → Racks and open a rack, then click Edit
- Drag a device from the left sidebar onto the rack visualization
- Drop it at the desired U position — a preview shows where the device will land
- Repeat for additional devices
Collision Detection
Stratora prevents overlapping placements. If you try to drop a device into a position occupied by another device, the builder highlights the conflict in red and blocks the placement. The same applies if a device would extend beyond the rack's height.
Front and Rear
Toggle between front and rear views of the rack. Devices placed on the rear face appear as ghost outlines when viewing the front, and vice versa — so you always know what's behind a device.
Inside a rack
Open any rack to see its full visualization — devices in their U-slot positions, slot numbers on the rack frame, front/rear toggle, and a side panel with rack details (height, device count, used/free U, location).
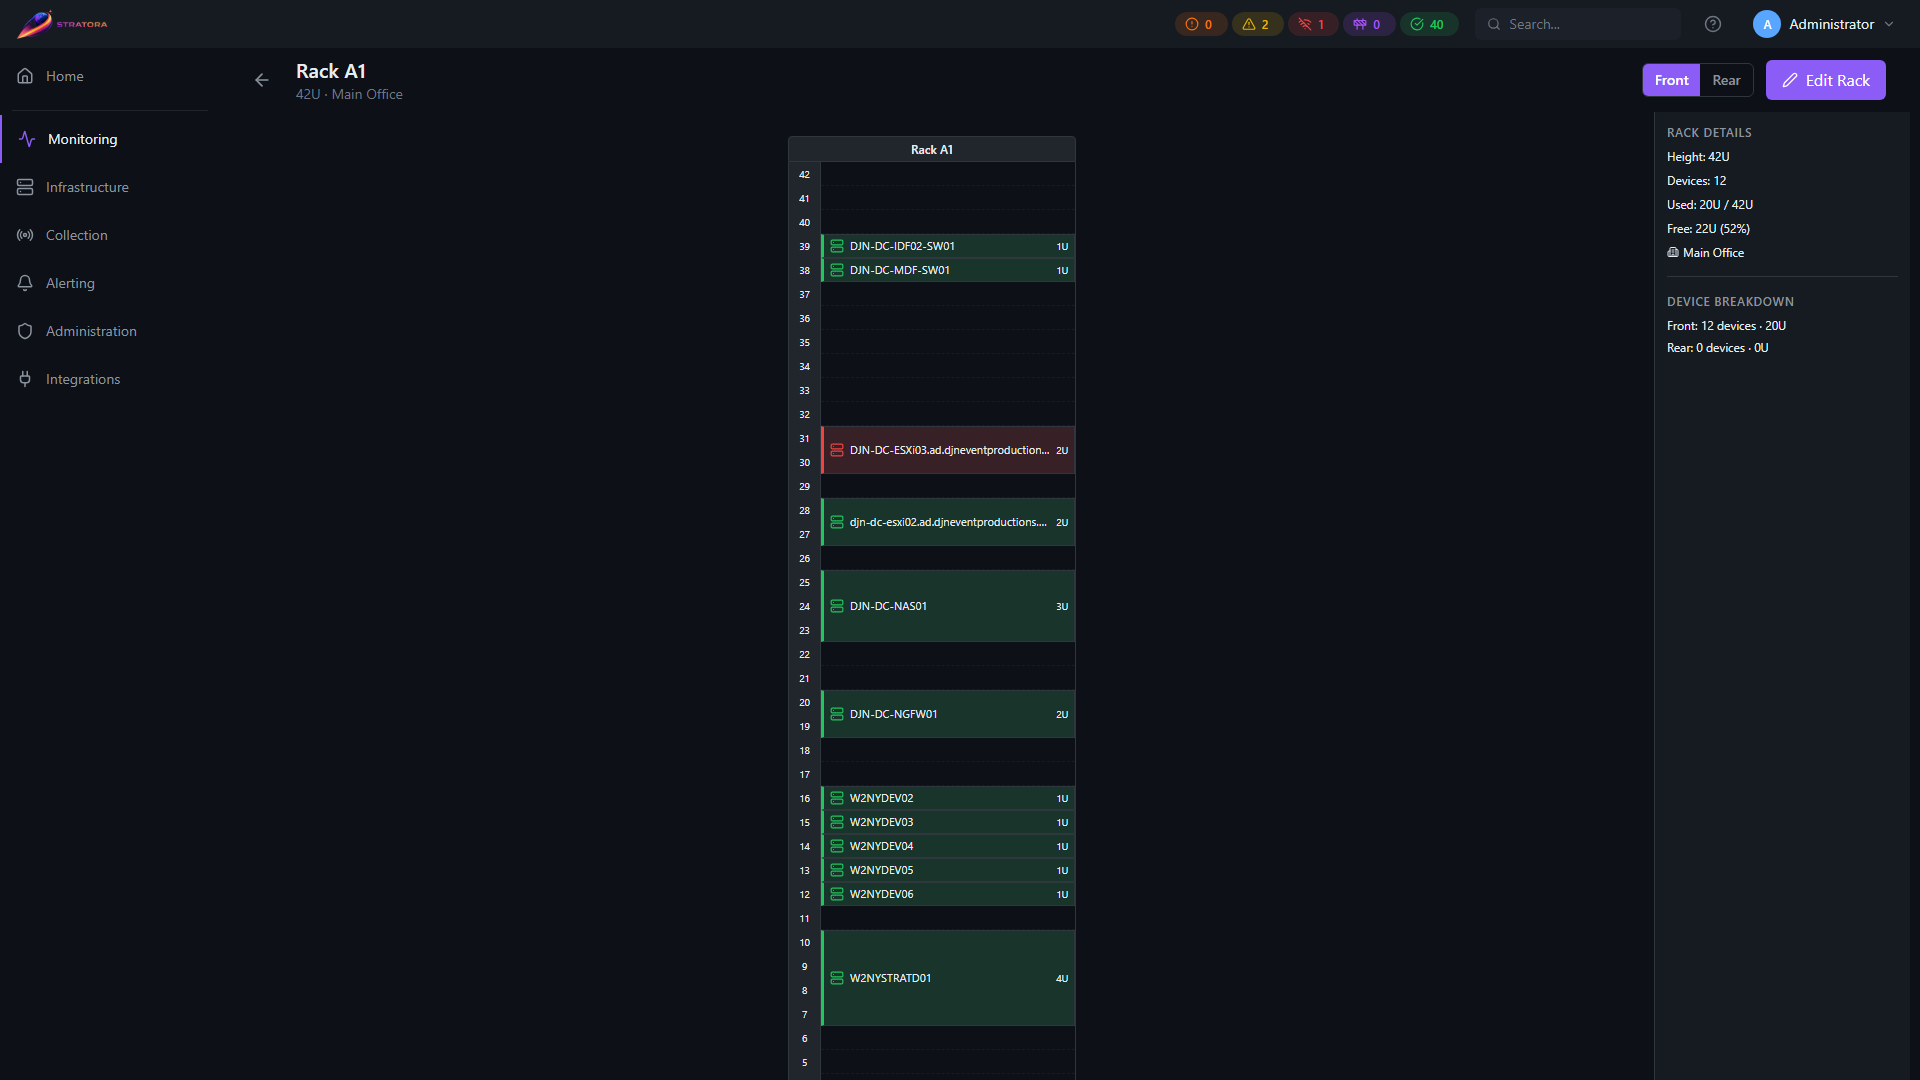
The rack visualization shows where every device sits in the physical equipment cabinet at a glance. Each placed device displays its name, U size, and a health-colored border so you can spot trouble without leaving the diagram.
Live Status Overlay
Every device in the rack displays a health-colored border that updates automatically (every 30 seconds):
| Color | Health State |
|---|---|
| Green | Healthy |
| Yellow | Warning |
| Orange | Critical |
| Red | Offline |
| Purple | Maintenance |
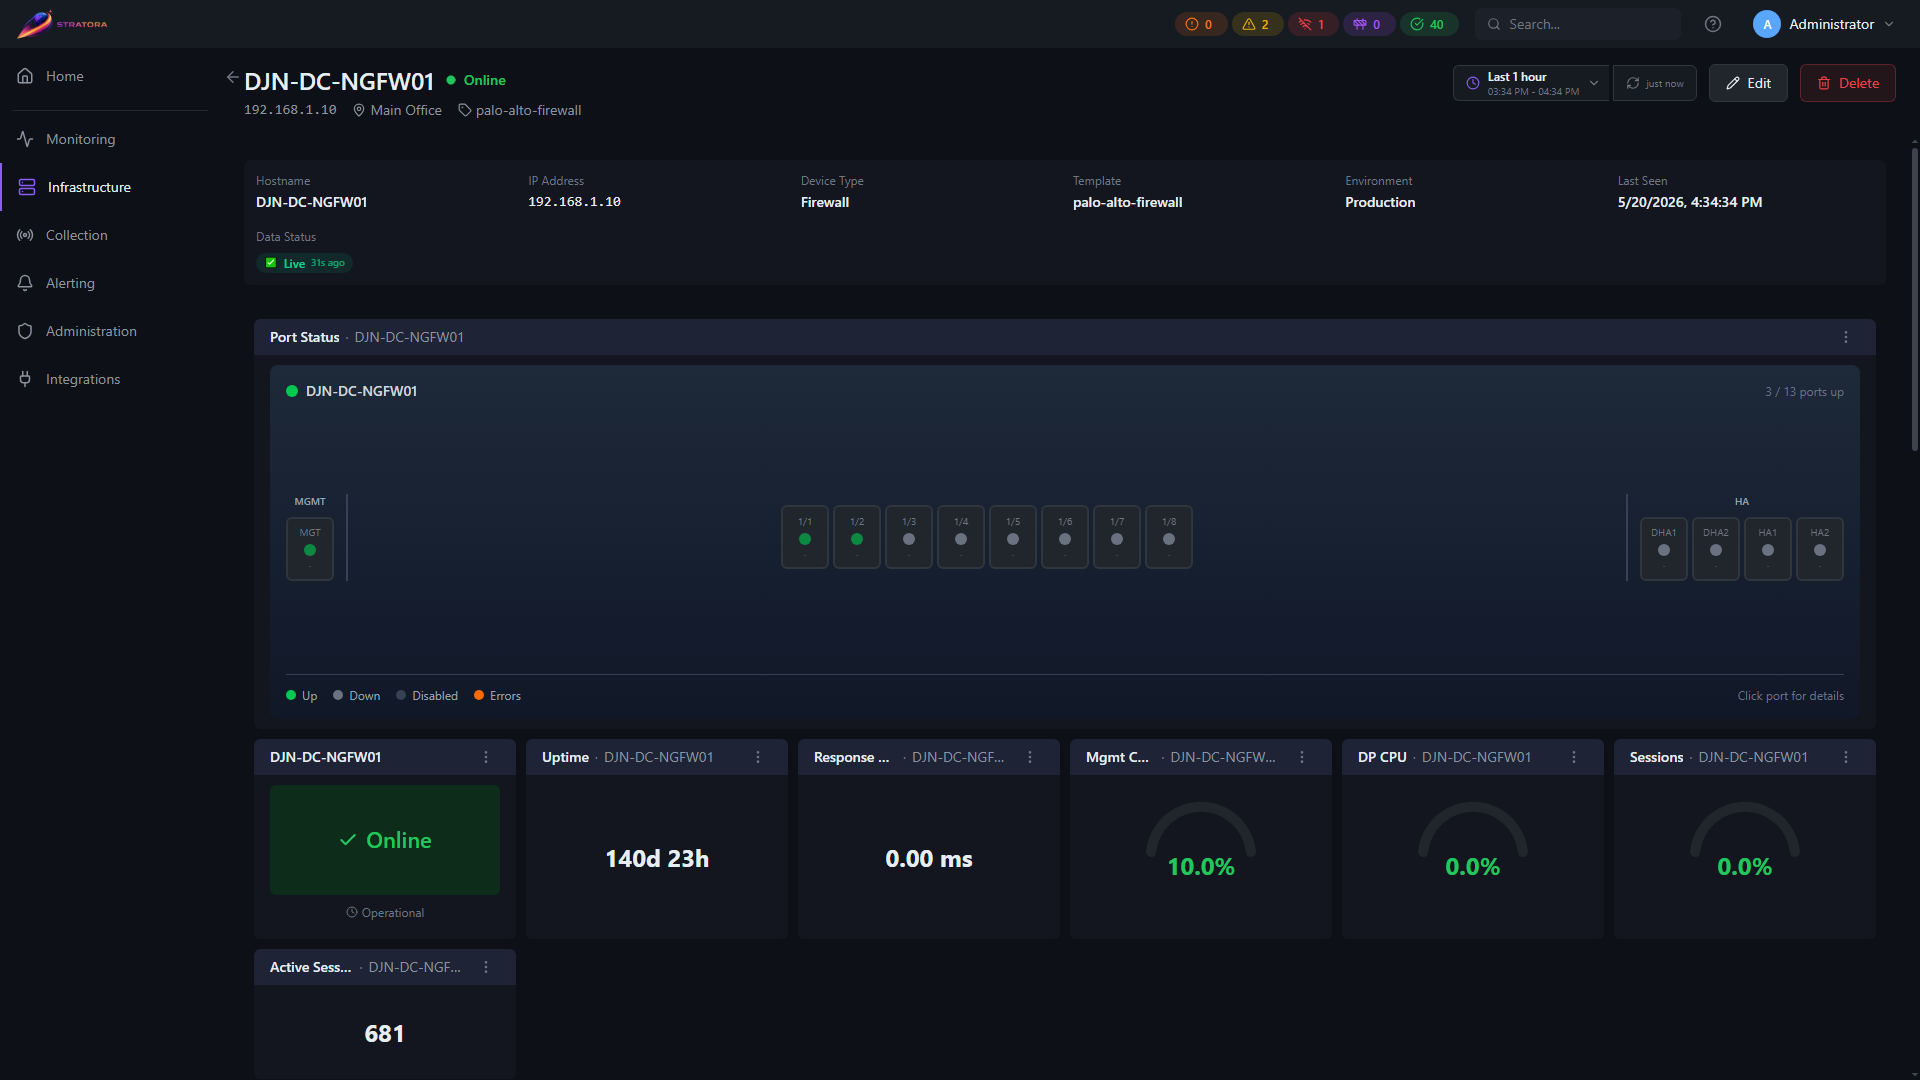
Hover over a device to see its name, U position range, and current health status. Click a device to navigate directly to its node detail page — the full per-node dashboard with metric panels, alert history, and configuration.
Rack Panels in Dashboards
Rack diagrams can be embedded as panels in dashboards. A single rack panel can display one or multiple racks in a responsive grid layout — useful for creating a "data center overview" dashboard showing all racks in a room at a glance.
Panel options include:
- Show labels — display device names on each asset
- Show U numbers — display rack unit numbering
- Compact mode — reduce whitespace for dense layouts
Use Cases
Data Center Documentation
Build rack layouts that match your physical environment. As you add, move, or decommission equipment, update the rack diagram to keep it current. Unlike a static spreadsheet, the live health overlay means your documentation is always showing real-time status.
Visual Health at a Glance
Embed rack panels in a wall-mounted NOC dashboard. A row of racks with red borders immediately tells operators which devices need attention and exactly where they are in the physical infrastructure.
Capacity Planning
See which rack positions are occupied and which are free. Identify racks nearing capacity before you need to install new equipment.