Generating Reports
Reports are generated on demand from a report template. Each run produces a PDF document covering the template's configured time range and site scope.
Running a Report
To generate a report:
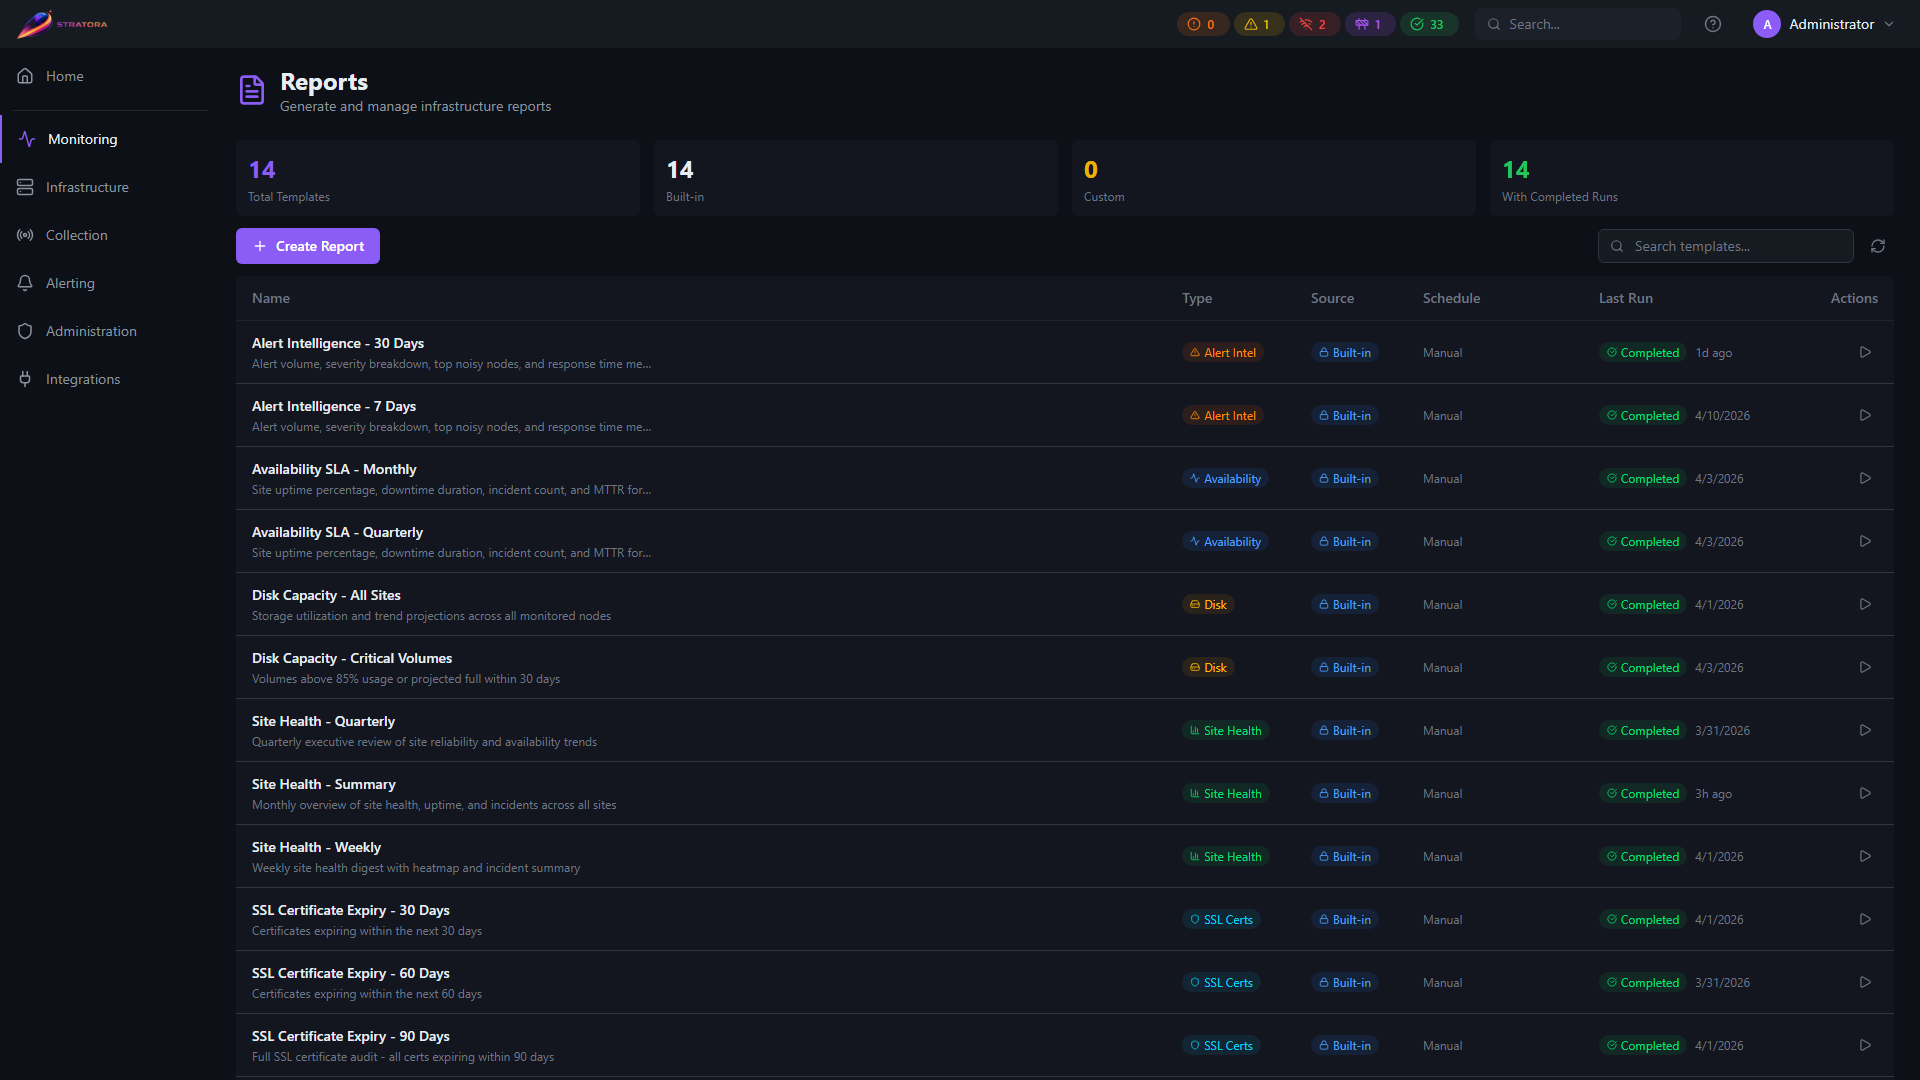
- Navigate to Reports in the sidebar
- Find the template you want to run
- Click Run Now
Stratora begins aggregating data from the reporting period and generating the PDF. This process runs in the background — you can navigate away and return later.
Generation Progress
After clicking Run Now, the template shows a progress indicator with the current status:
| Status | Meaning |
|---|---|
| Queued | The report is waiting to be processed |
| Generating | Data is being aggregated and the PDF is being built |
| Completed | The report is ready to download |
| Failed | An error occurred during generation — check the error details for more information |
Generation time depends on the number of sites, nodes, and the length of the reporting period. A 30-day report across a handful of sites typically completes in under a minute.
Downloading the PDF
Once a report reaches Completed status:
- Open the template detail view
- Find the completed run in the run history
- Click Download PDF
The PDF is formatted for print and digital viewing, with a cover page, table of contents, and clearly labeled sections.
Reports are designed to be shared directly with stakeholders. The PDF includes all context needed to understand the data — no Stratora access required for the reader.
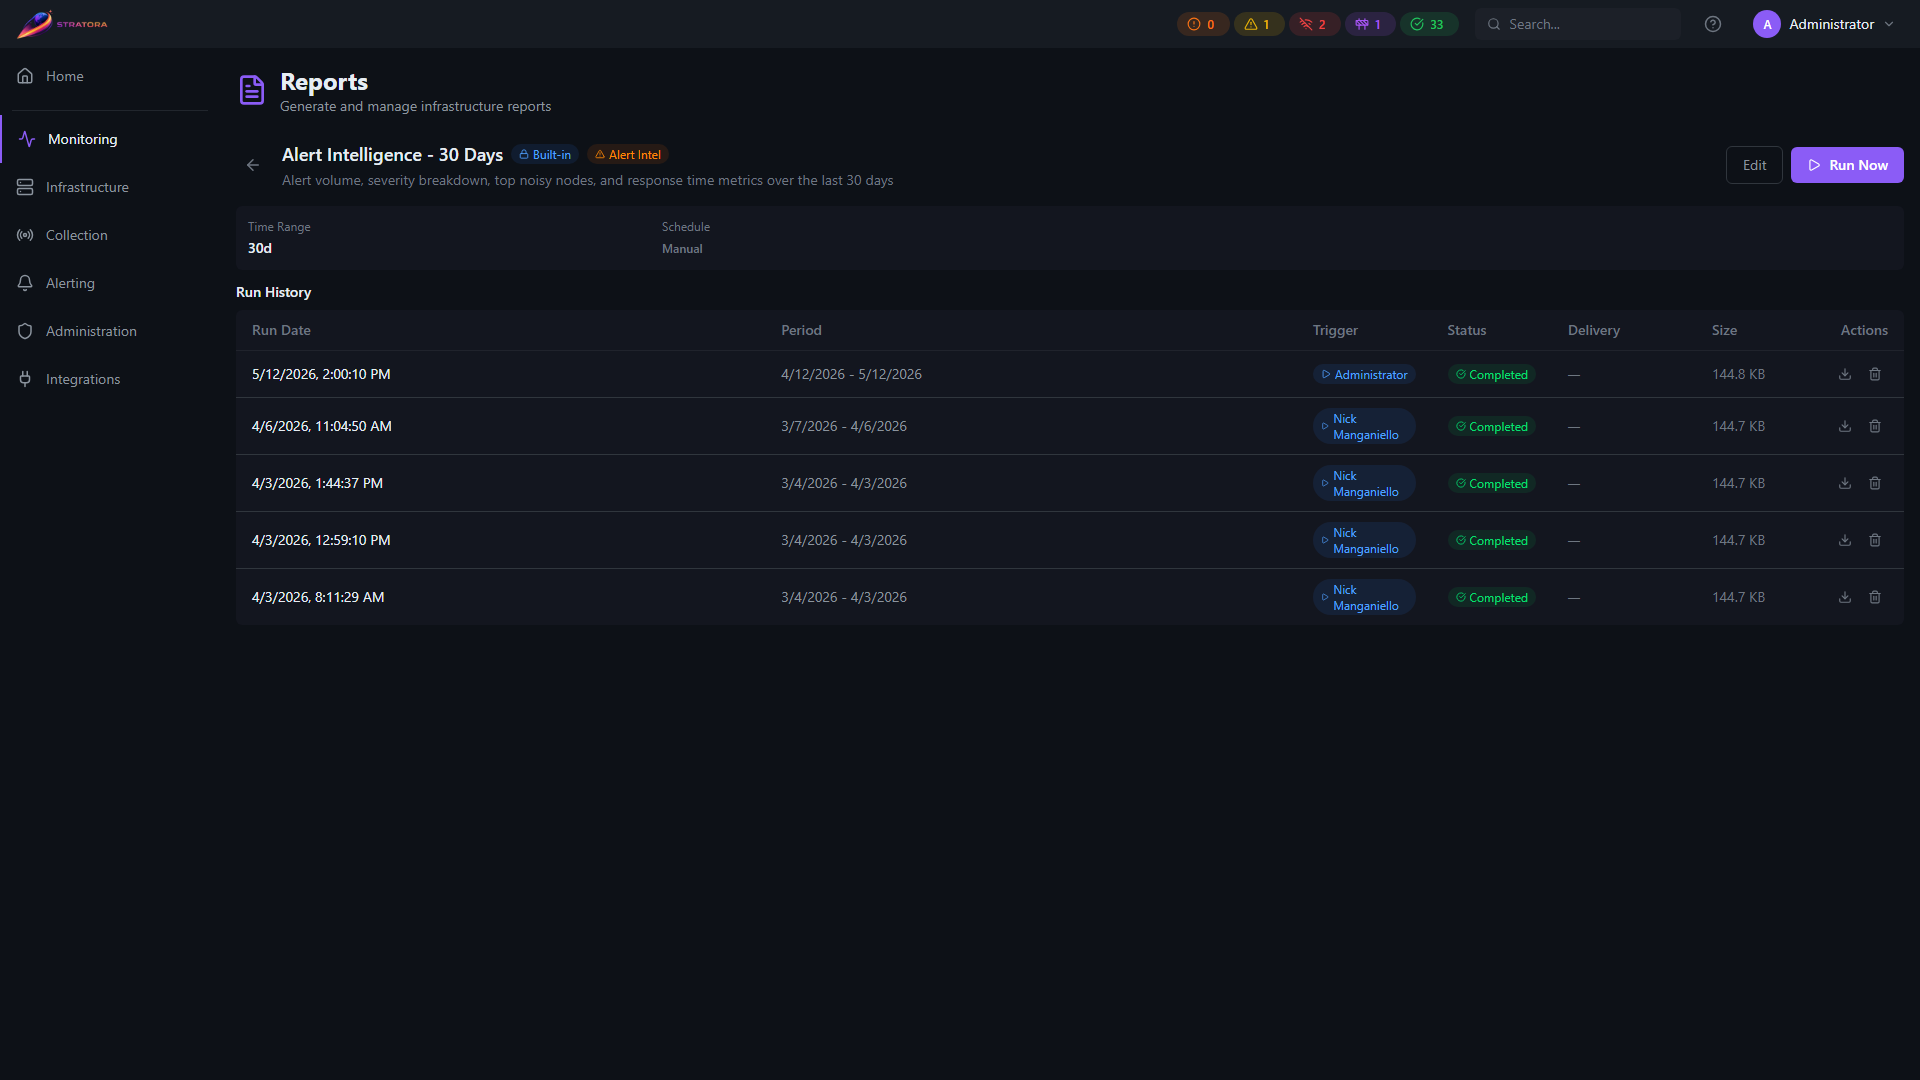
Run History
Each template maintains a history of all previous runs. Open a template to see its run history, which includes:
| Field | Description |
|---|---|
| Run Date | When the report was generated |
| Status | Completed, Failed, or Generating |
| Time Range | The reporting period covered (e.g., "Feb 1 – Mar 2, 2026") |
| Sites | Number of sites included |
| Generated By | The user who triggered the run |
| Download link (for completed runs) |
Re-running a Template
You can run the same template multiple times. Each run captures a snapshot of the data at that point in time, covering the configured time range relative to when the run was triggered.
For example, running a 30-day template on March 1 covers February 1–March 1. Running the same template on March 15 covers February 13–March 15.
Reports use pre-aggregated hourly snapshots, so generating a report does not place additional load on your collectors or monitoring infrastructure.